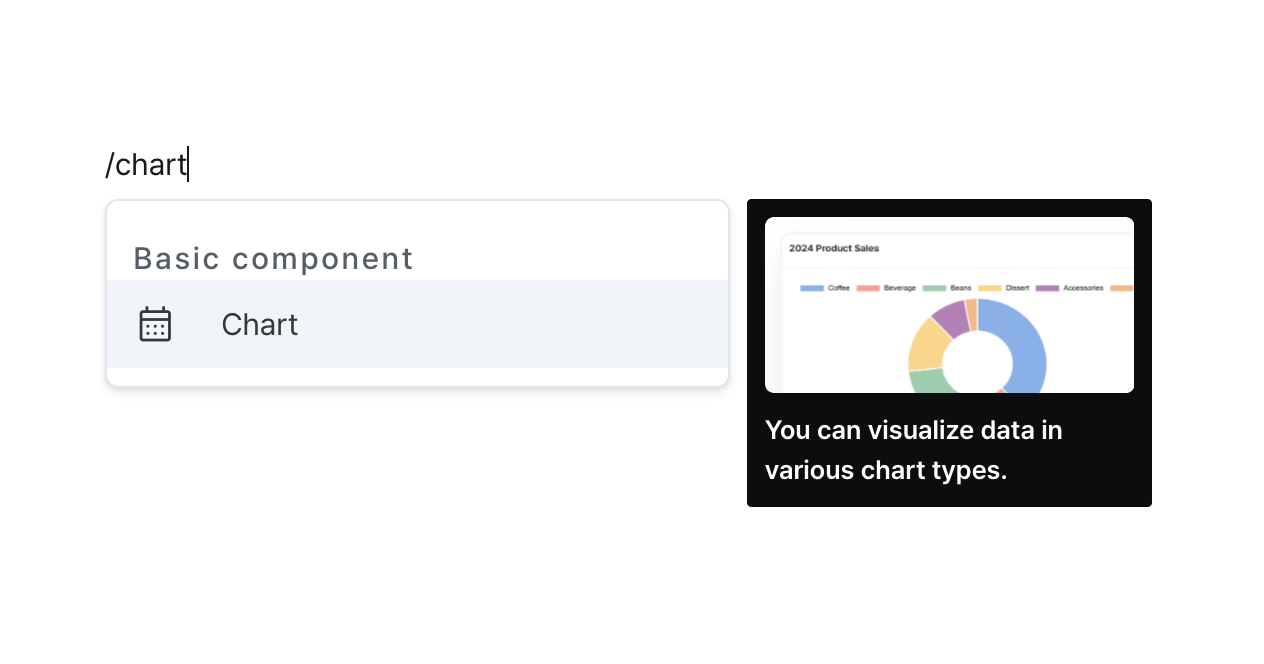
Chart
Transform your data into visual insights through various chart types.
Properties
| Property | Type | Description |
|---|---|---|
| Name (name) | string | Unique identifier for the chart component |
| Data (code) | string (ChartData) | Data to display in the chart |
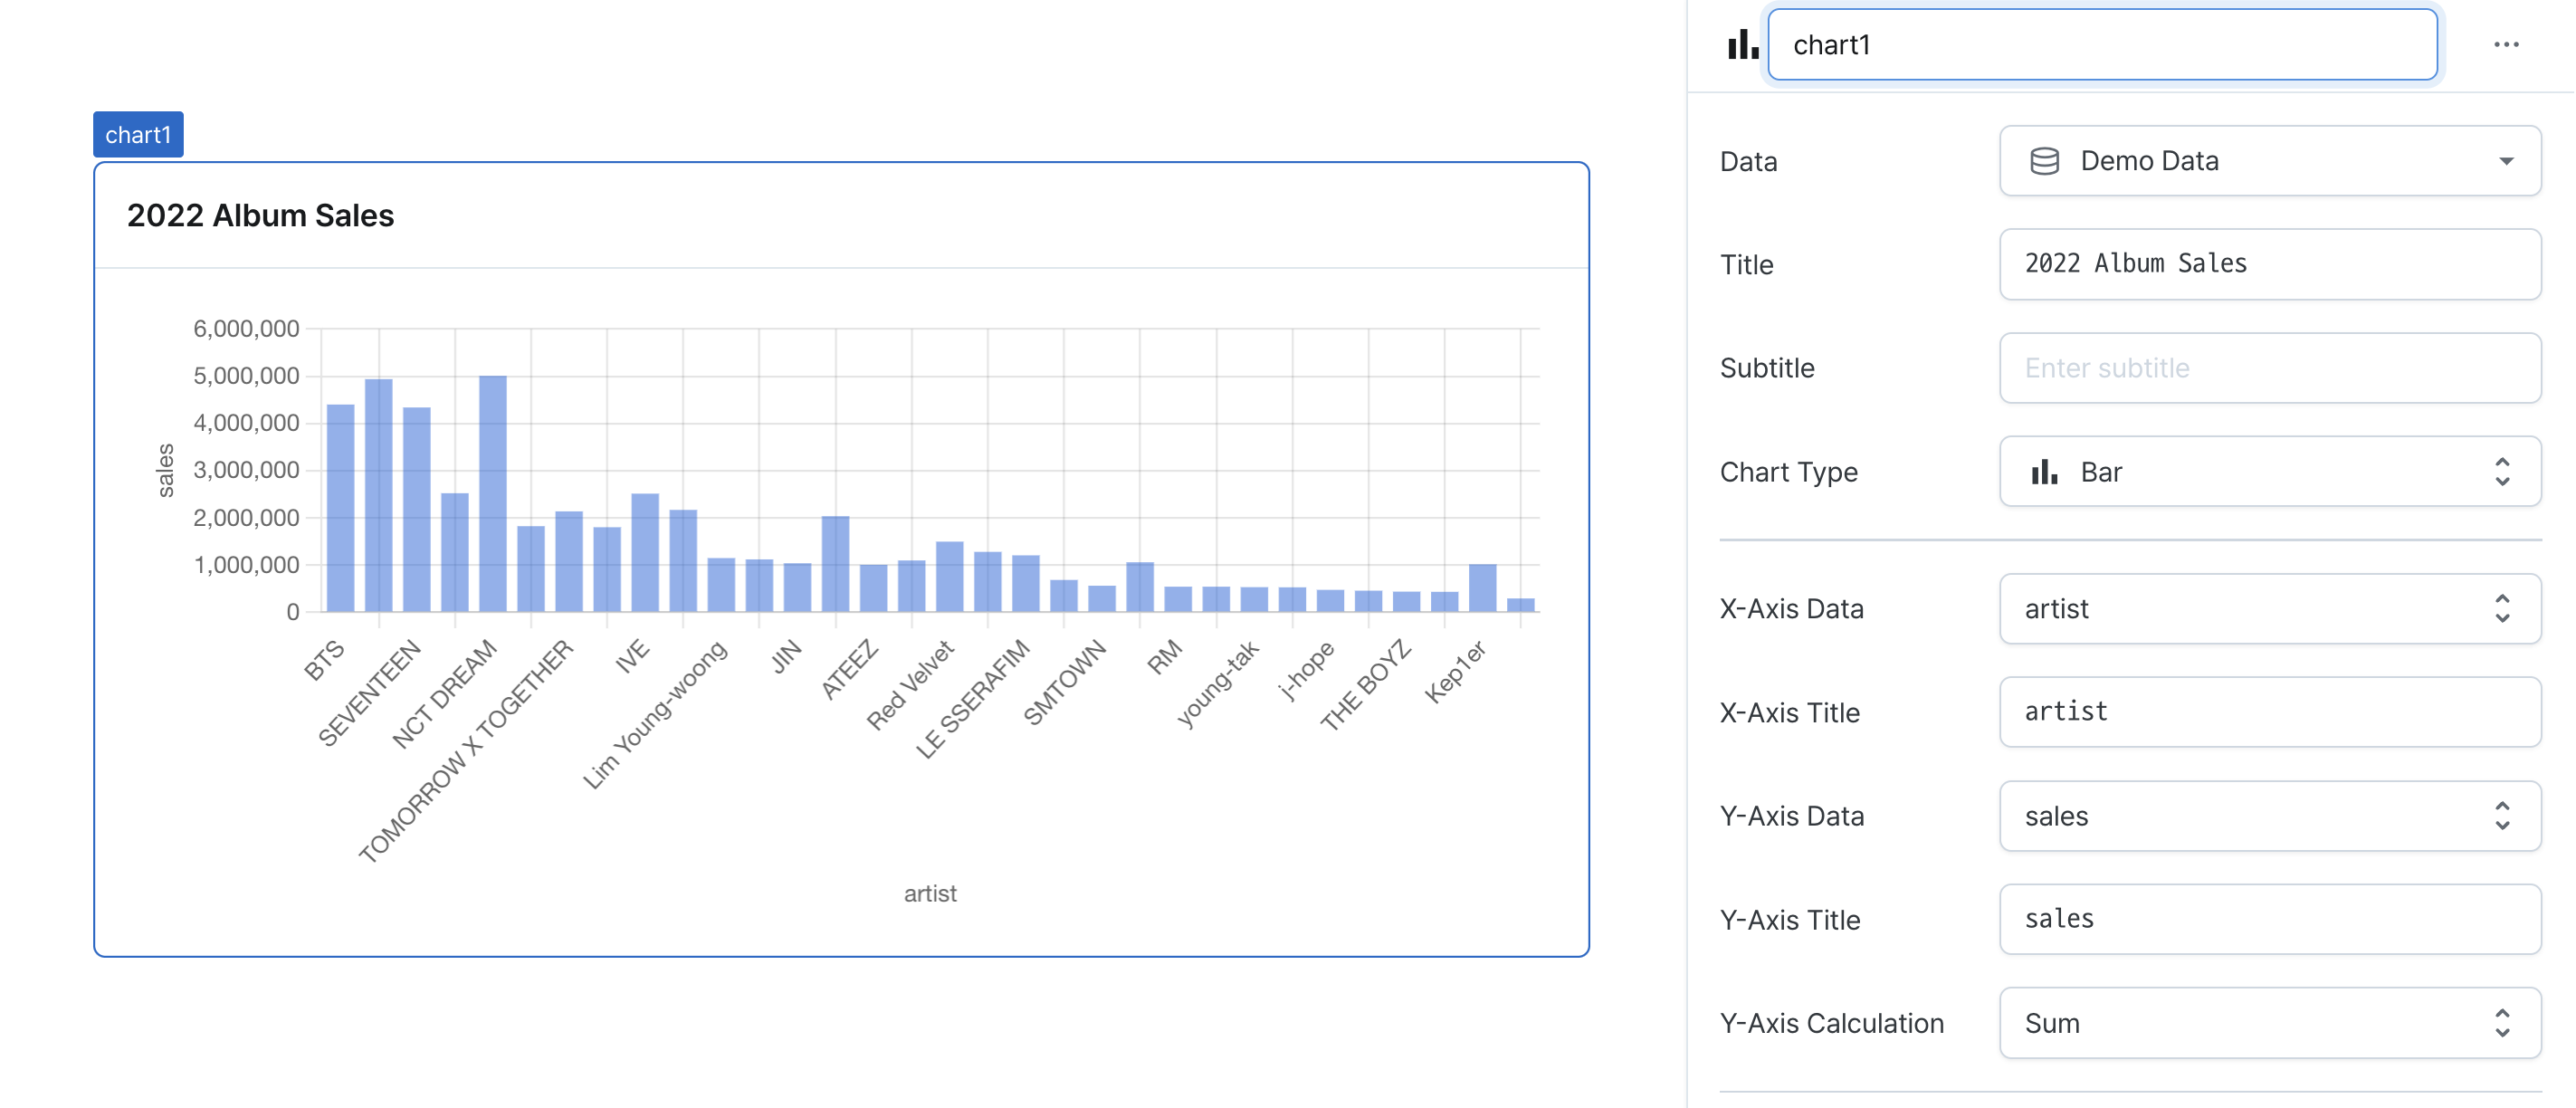
| Title (title) | string | Title displayed at the top of the chart |
| Subtitle (subtitle) | string | Subtitle displayed at the top of the chart |
| Chart Type (type) | ChartType | Type of chart to display |
| X-Axis (xAxis) | ChartXAXis | X-axis data and title |
| Y-axis type, title, calculation function (datasets) | ChartDataset[] | Y-axis type, title and calculation function datasets |
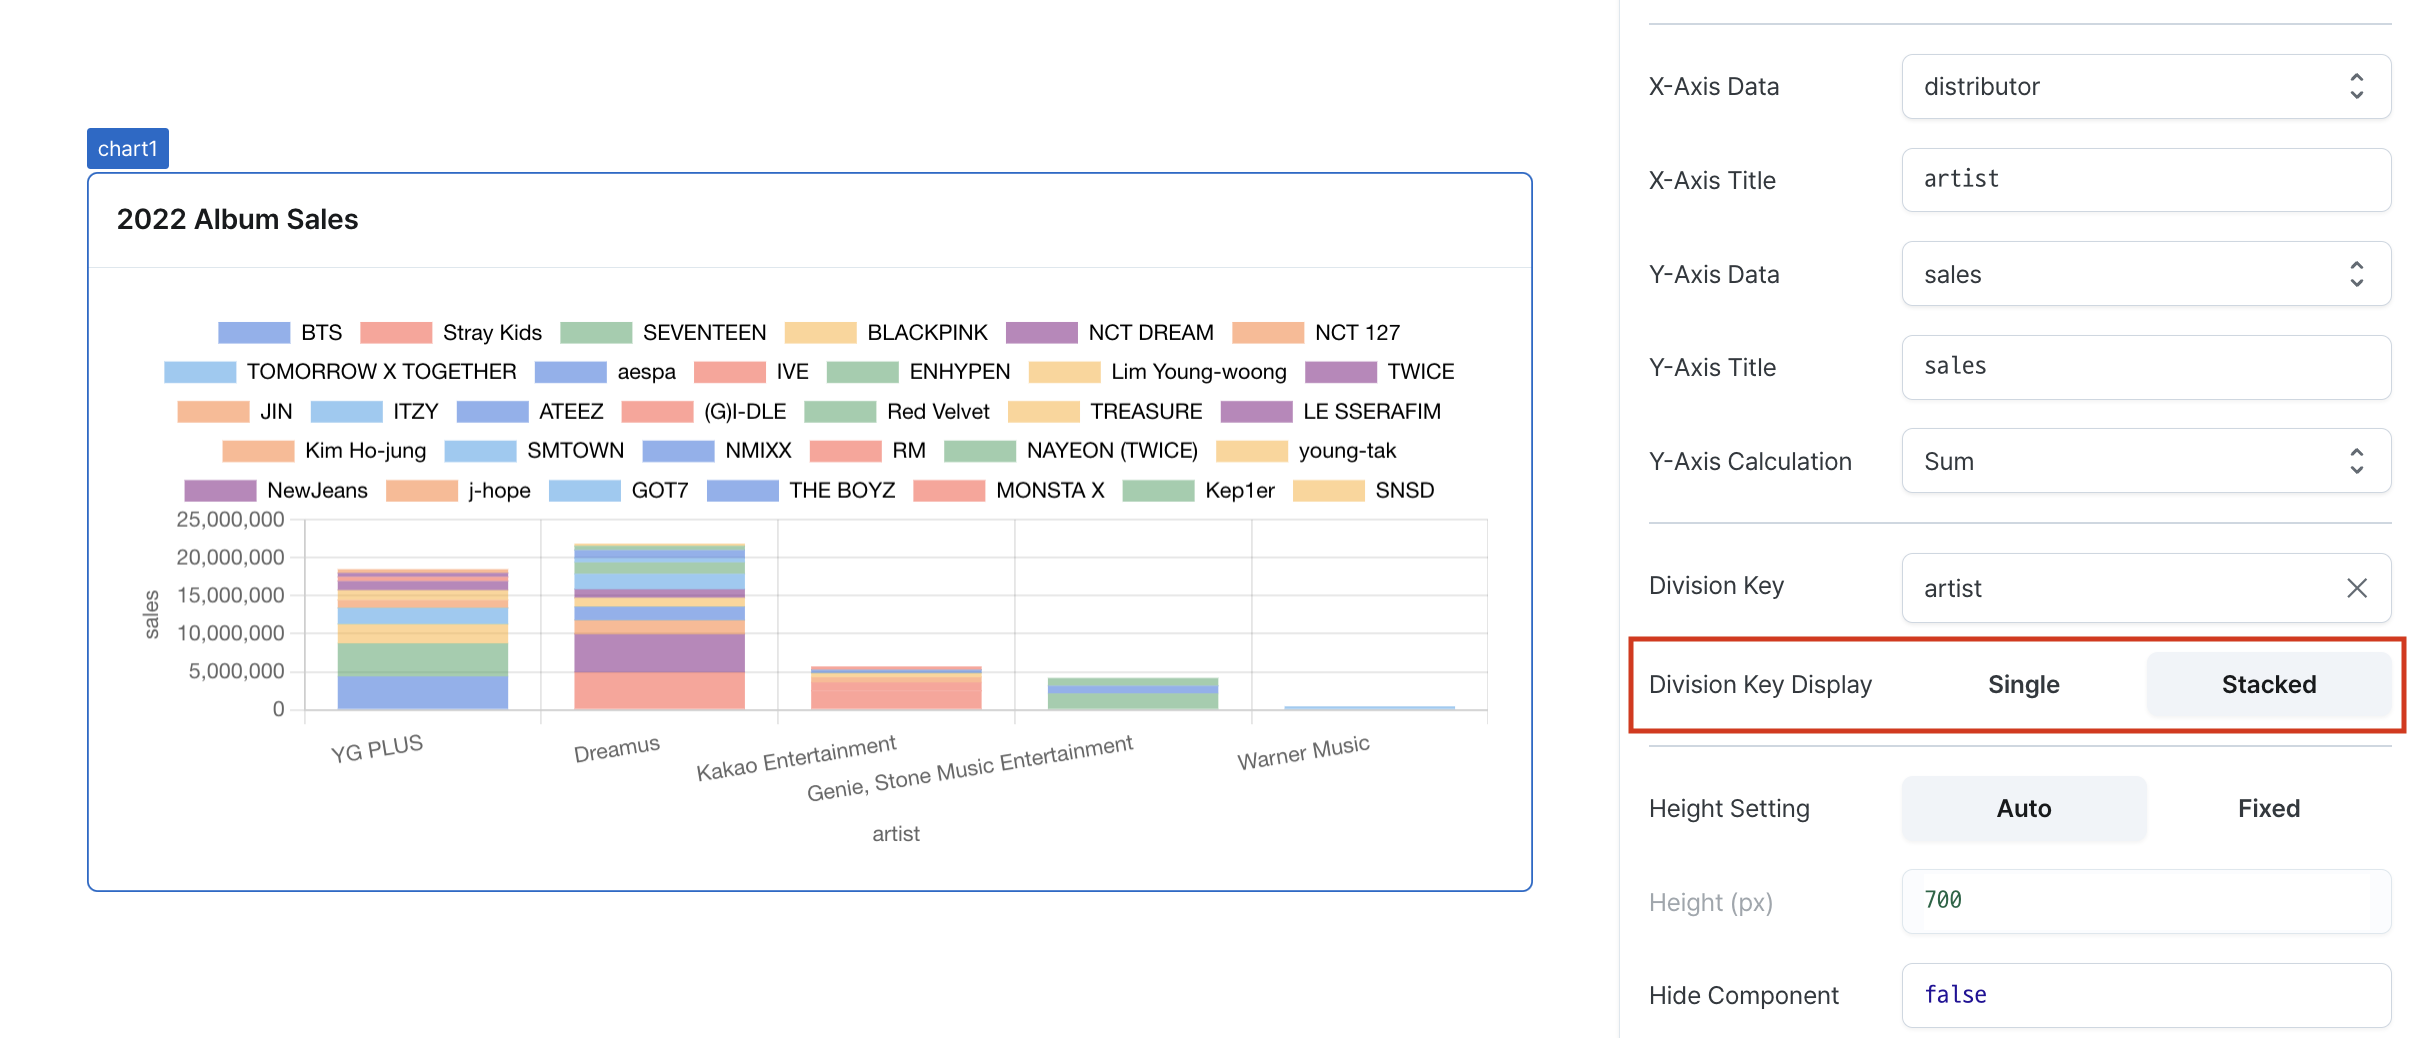
| Division Key (divider) | ChartDivider | Key to split Y-axis data |
| Division Key Display (isStacked) | boolean | Enable stacked bar chart |
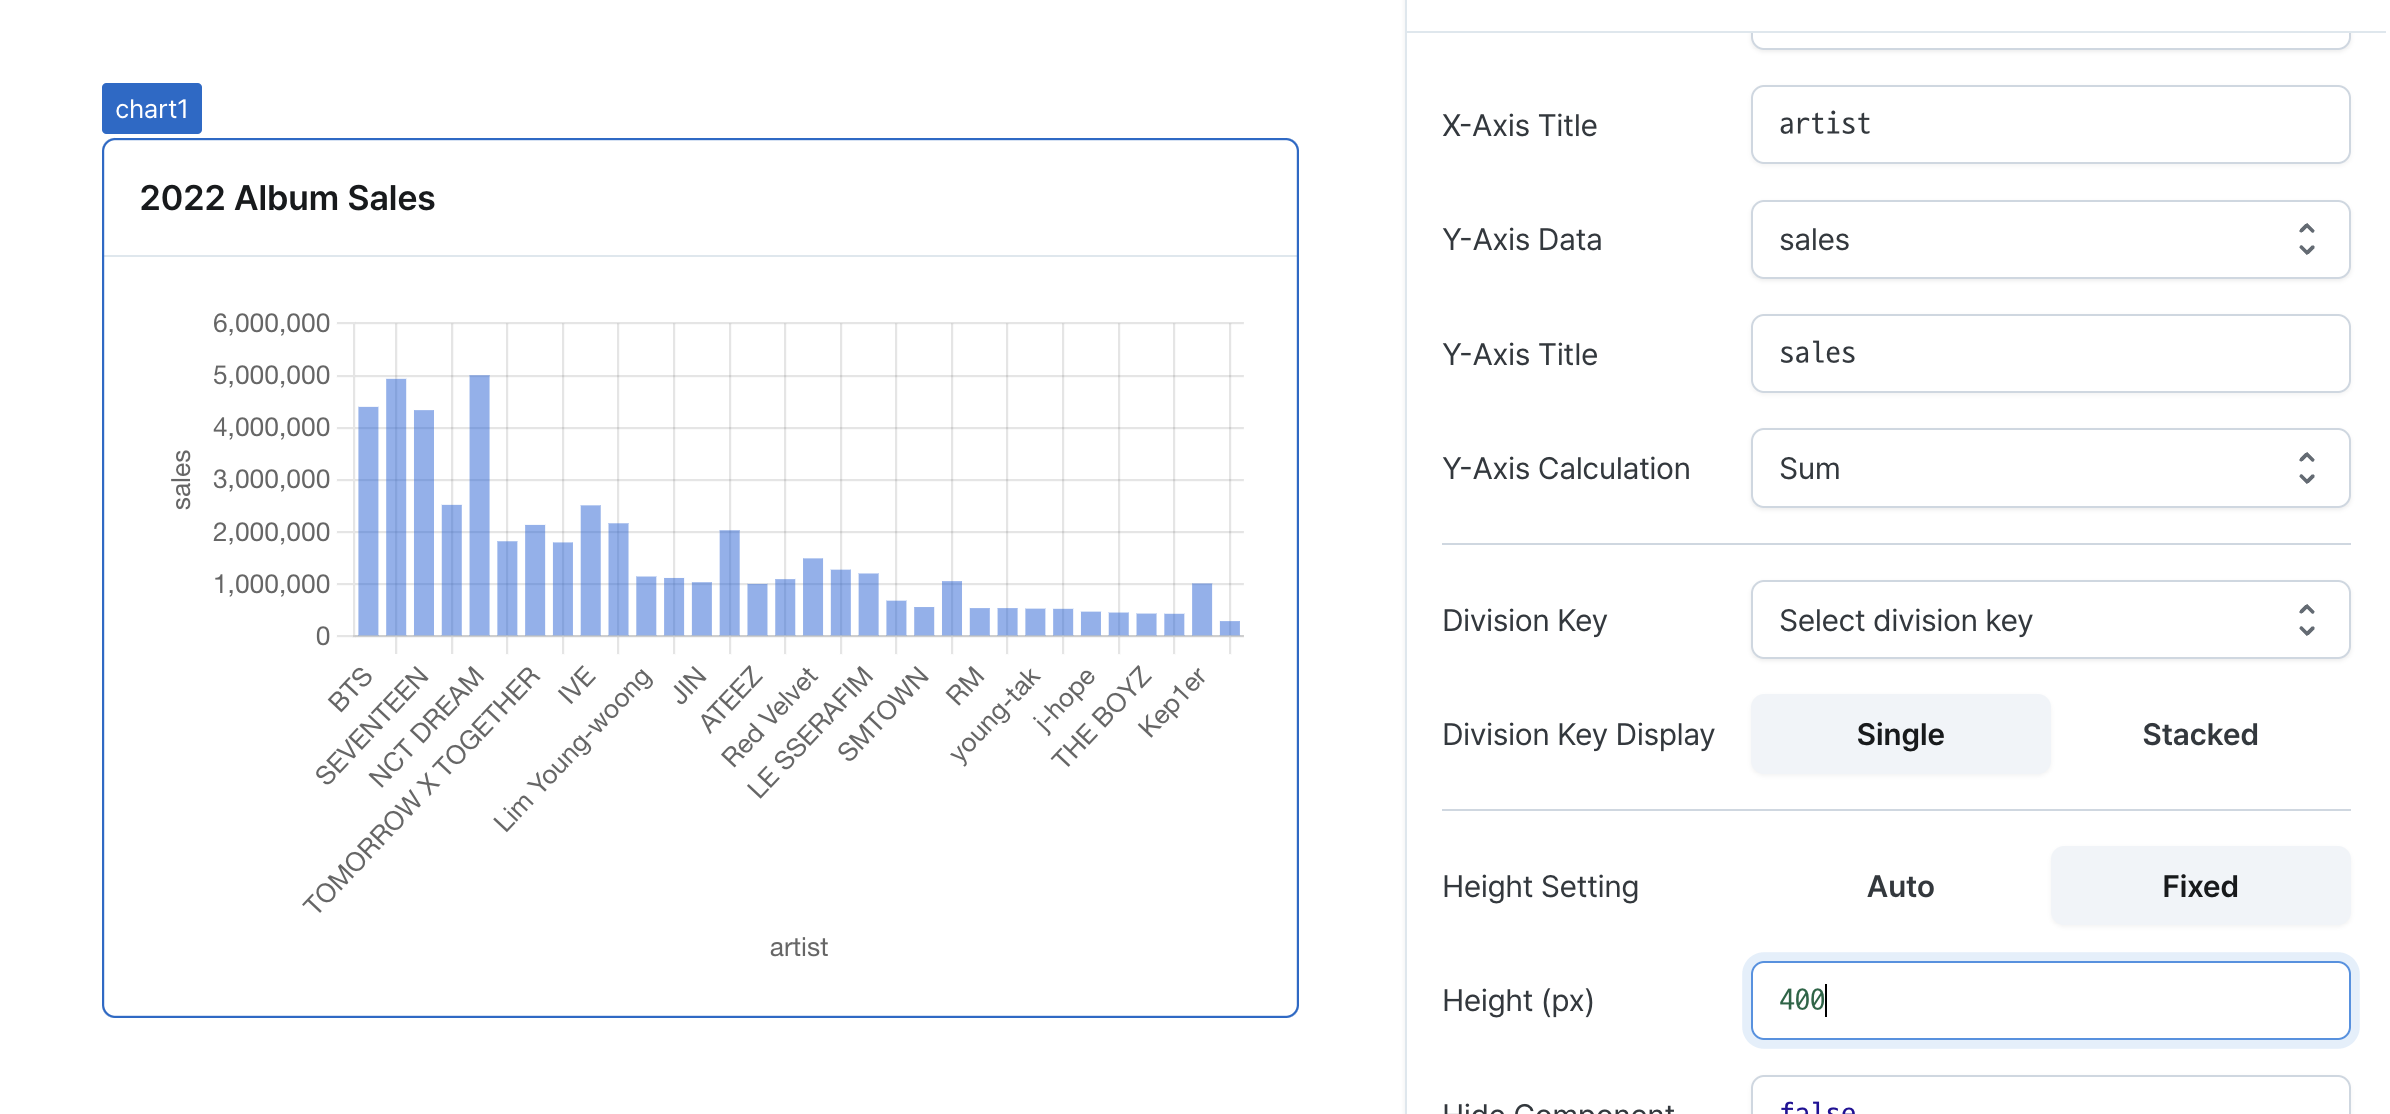
| Height Setting (isHeightFixed) | boolean | Enable fixed height for the chart |
| Height (px) (contentHeight) | string | Fixed height of the chart |
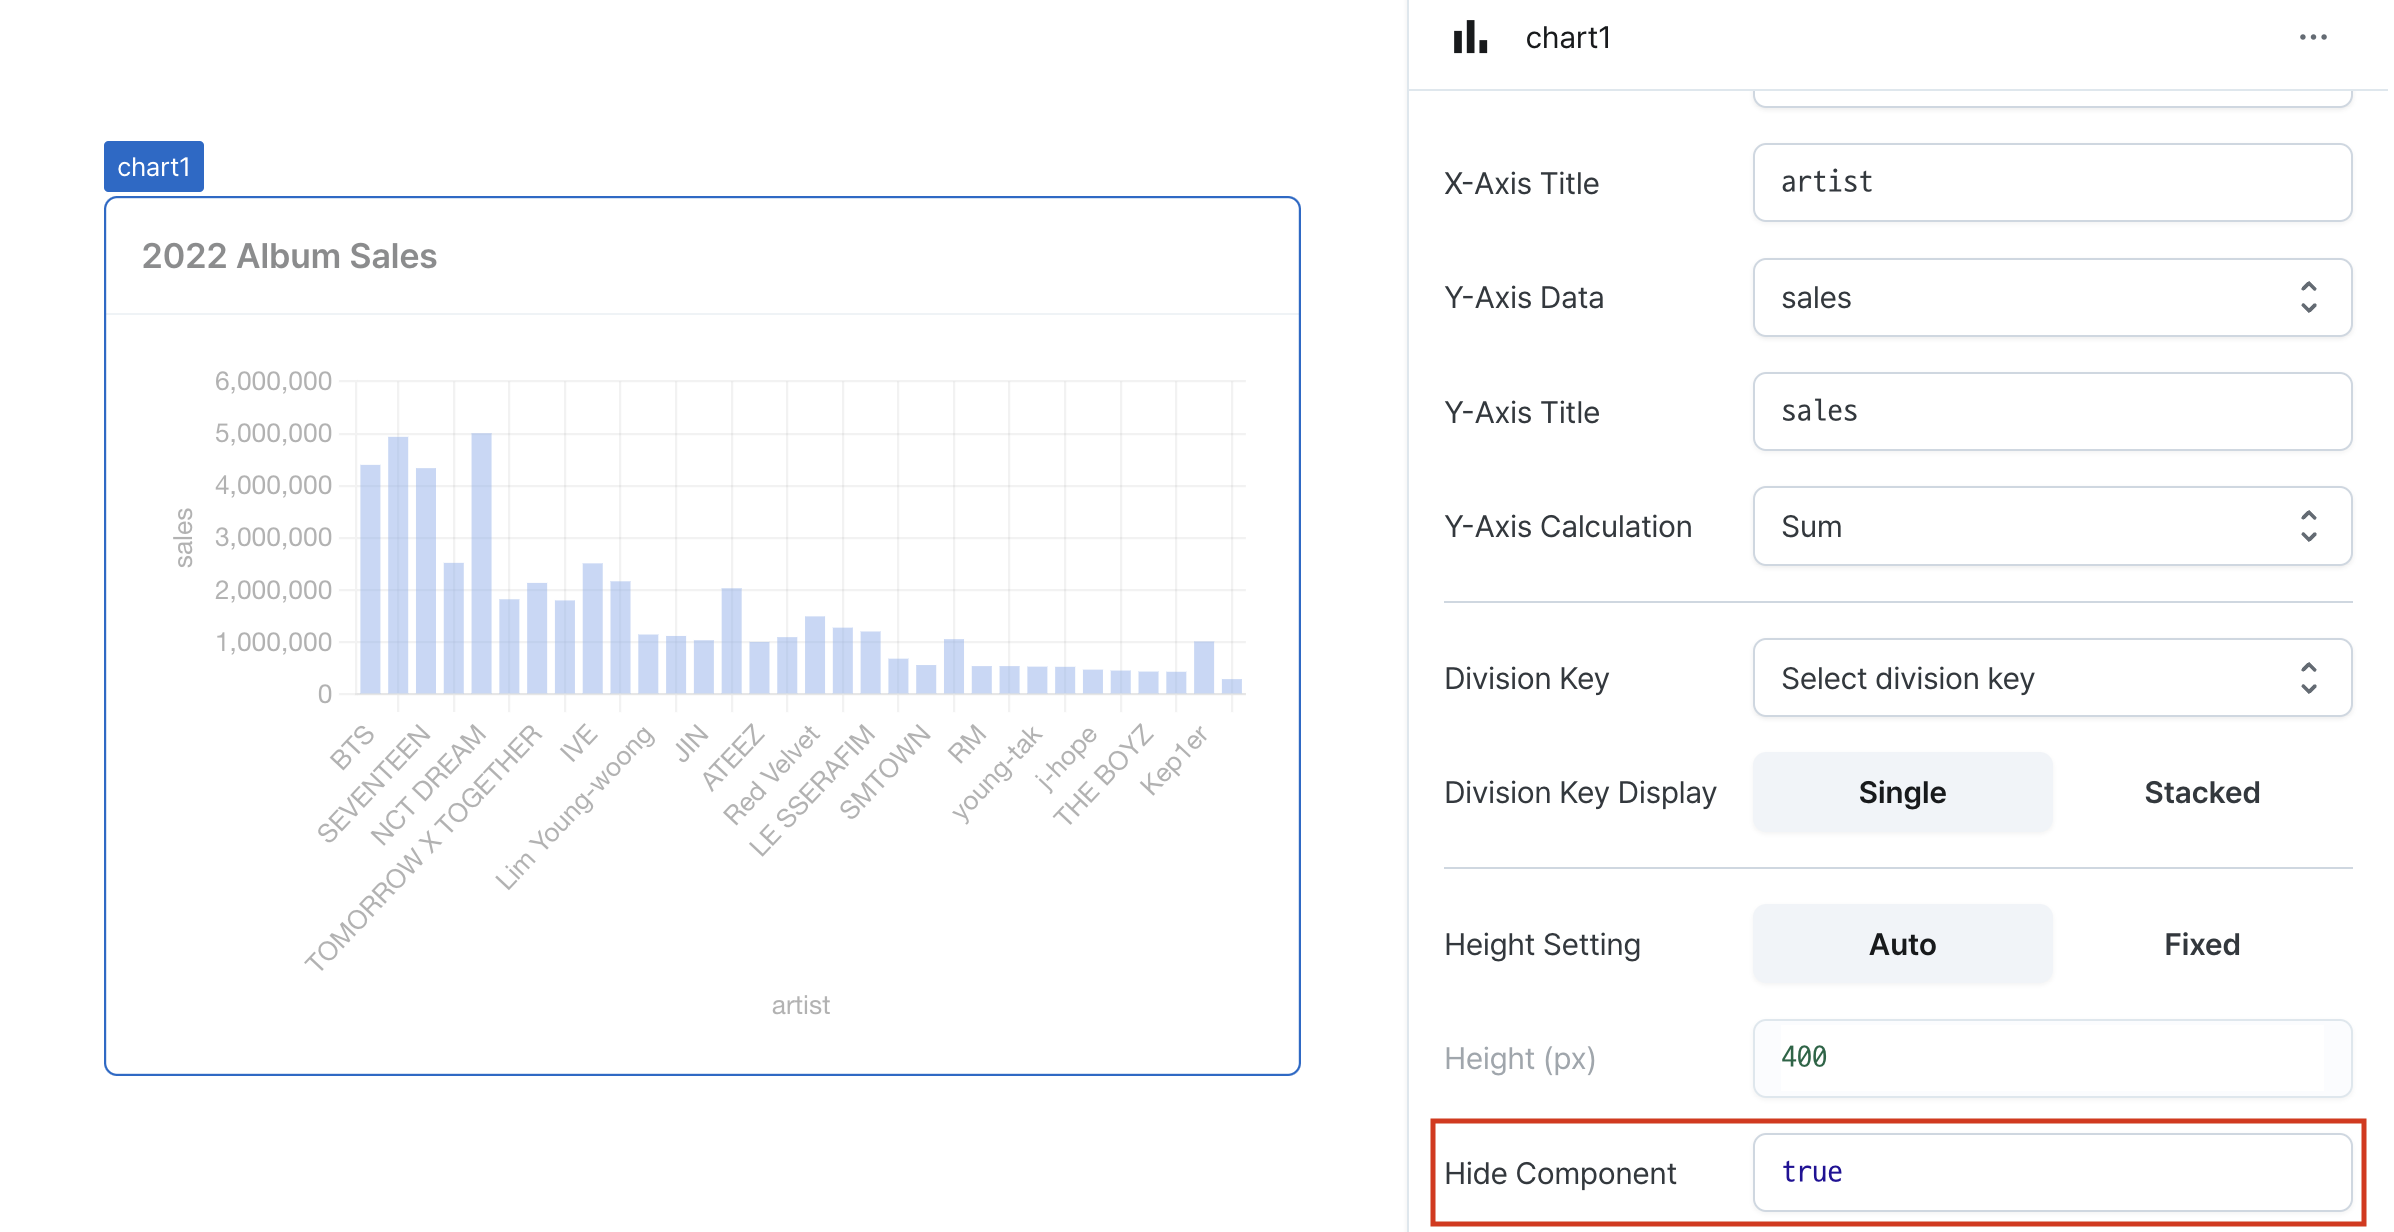
| Hide Component (isHidden) | boolean | Whether to hide the chart on the deployed page |
Name (name)
Unique identifier for the chart component. Please refer to the component naming rules
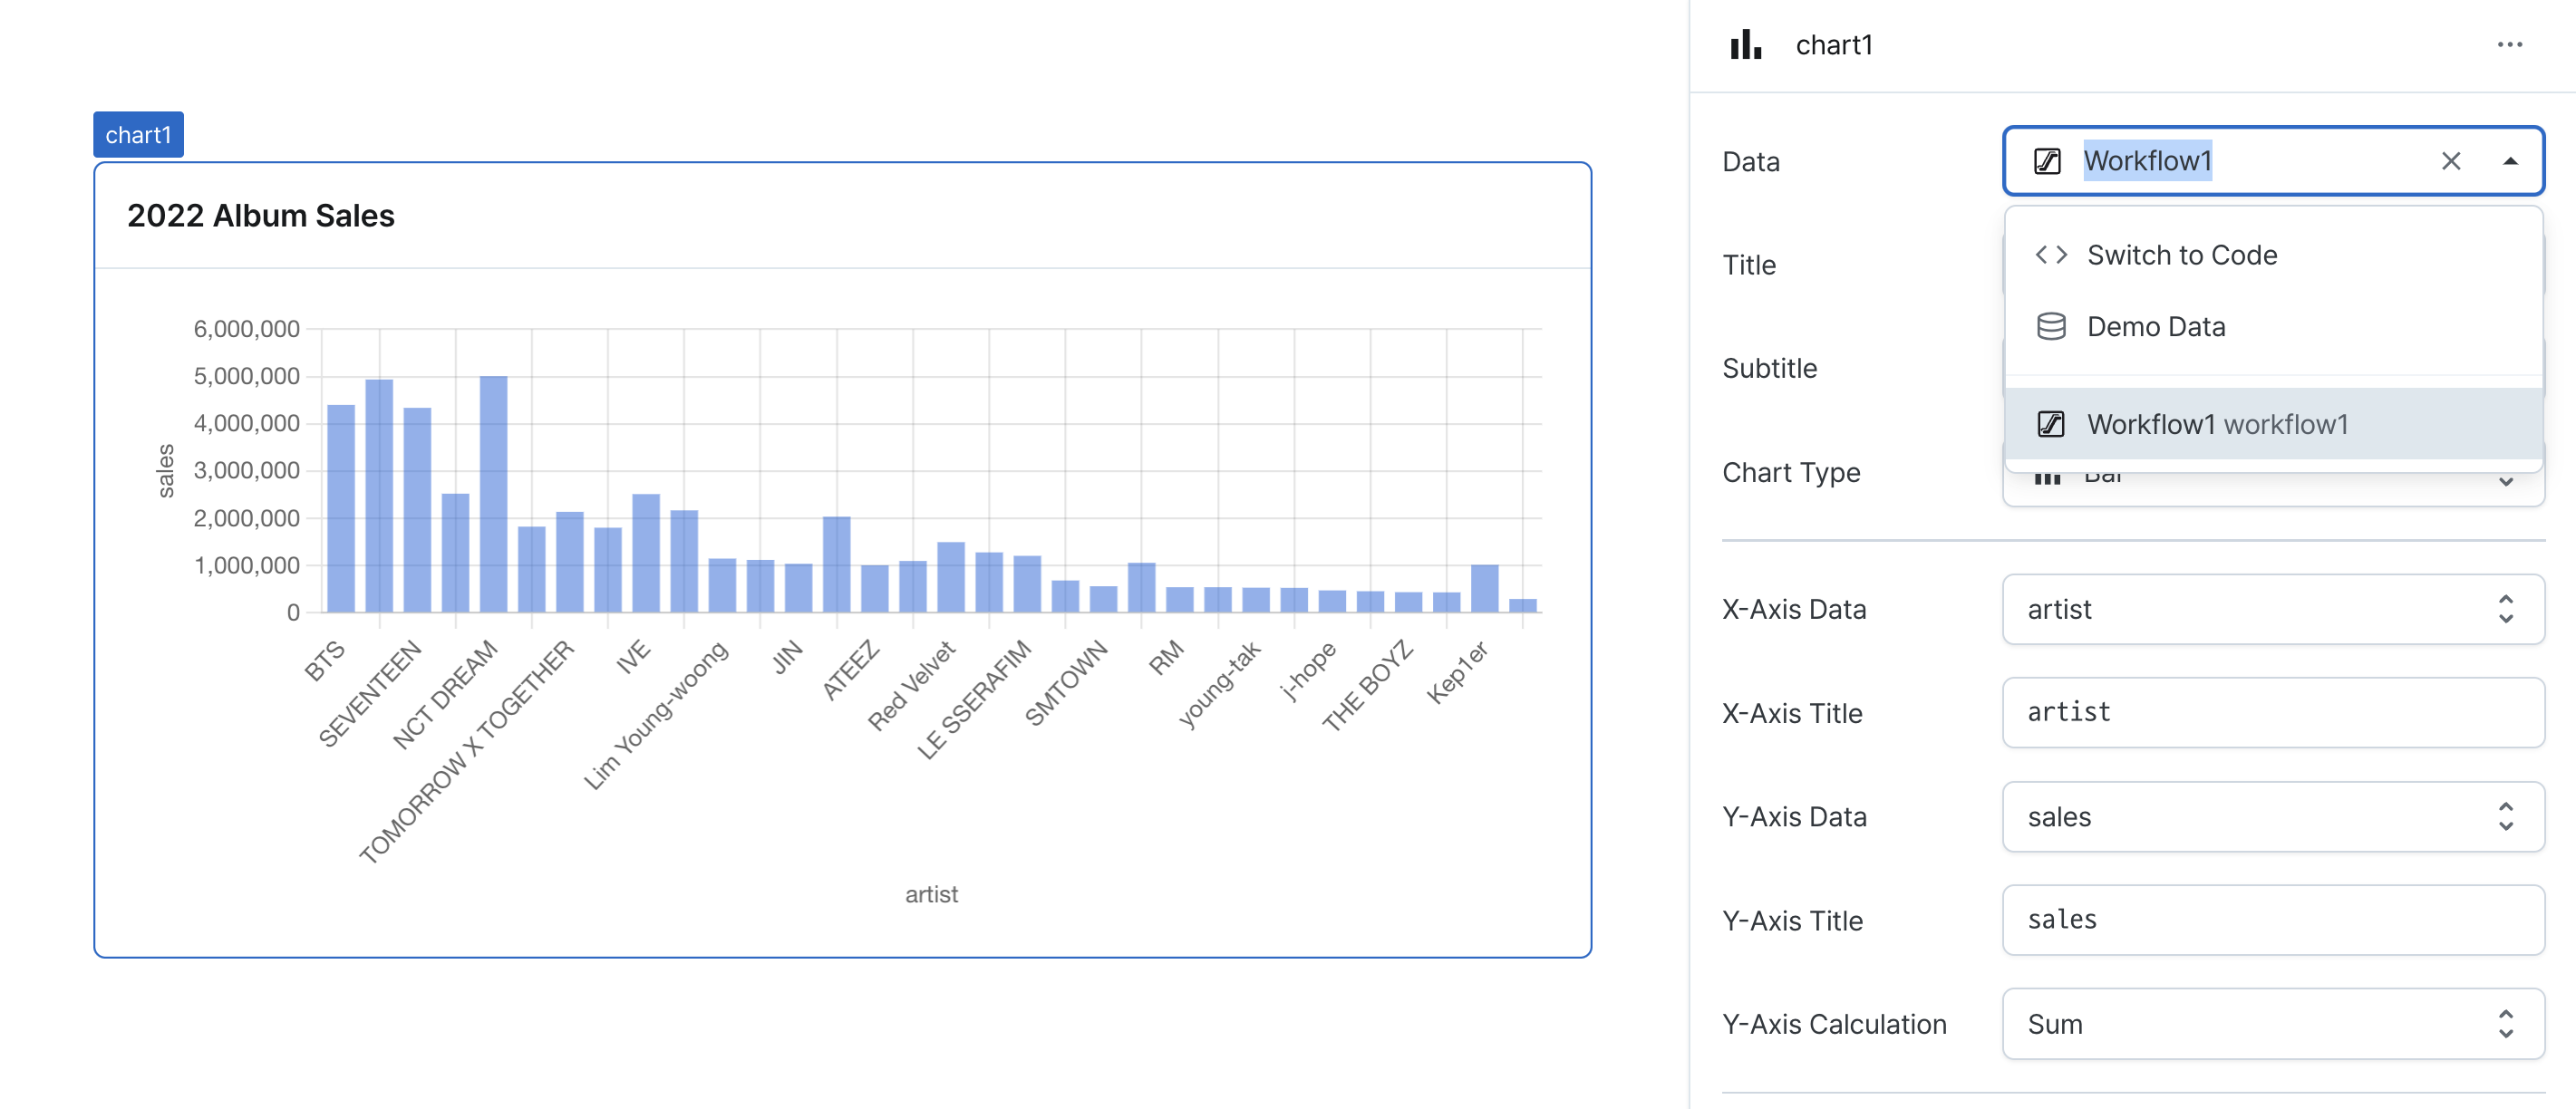
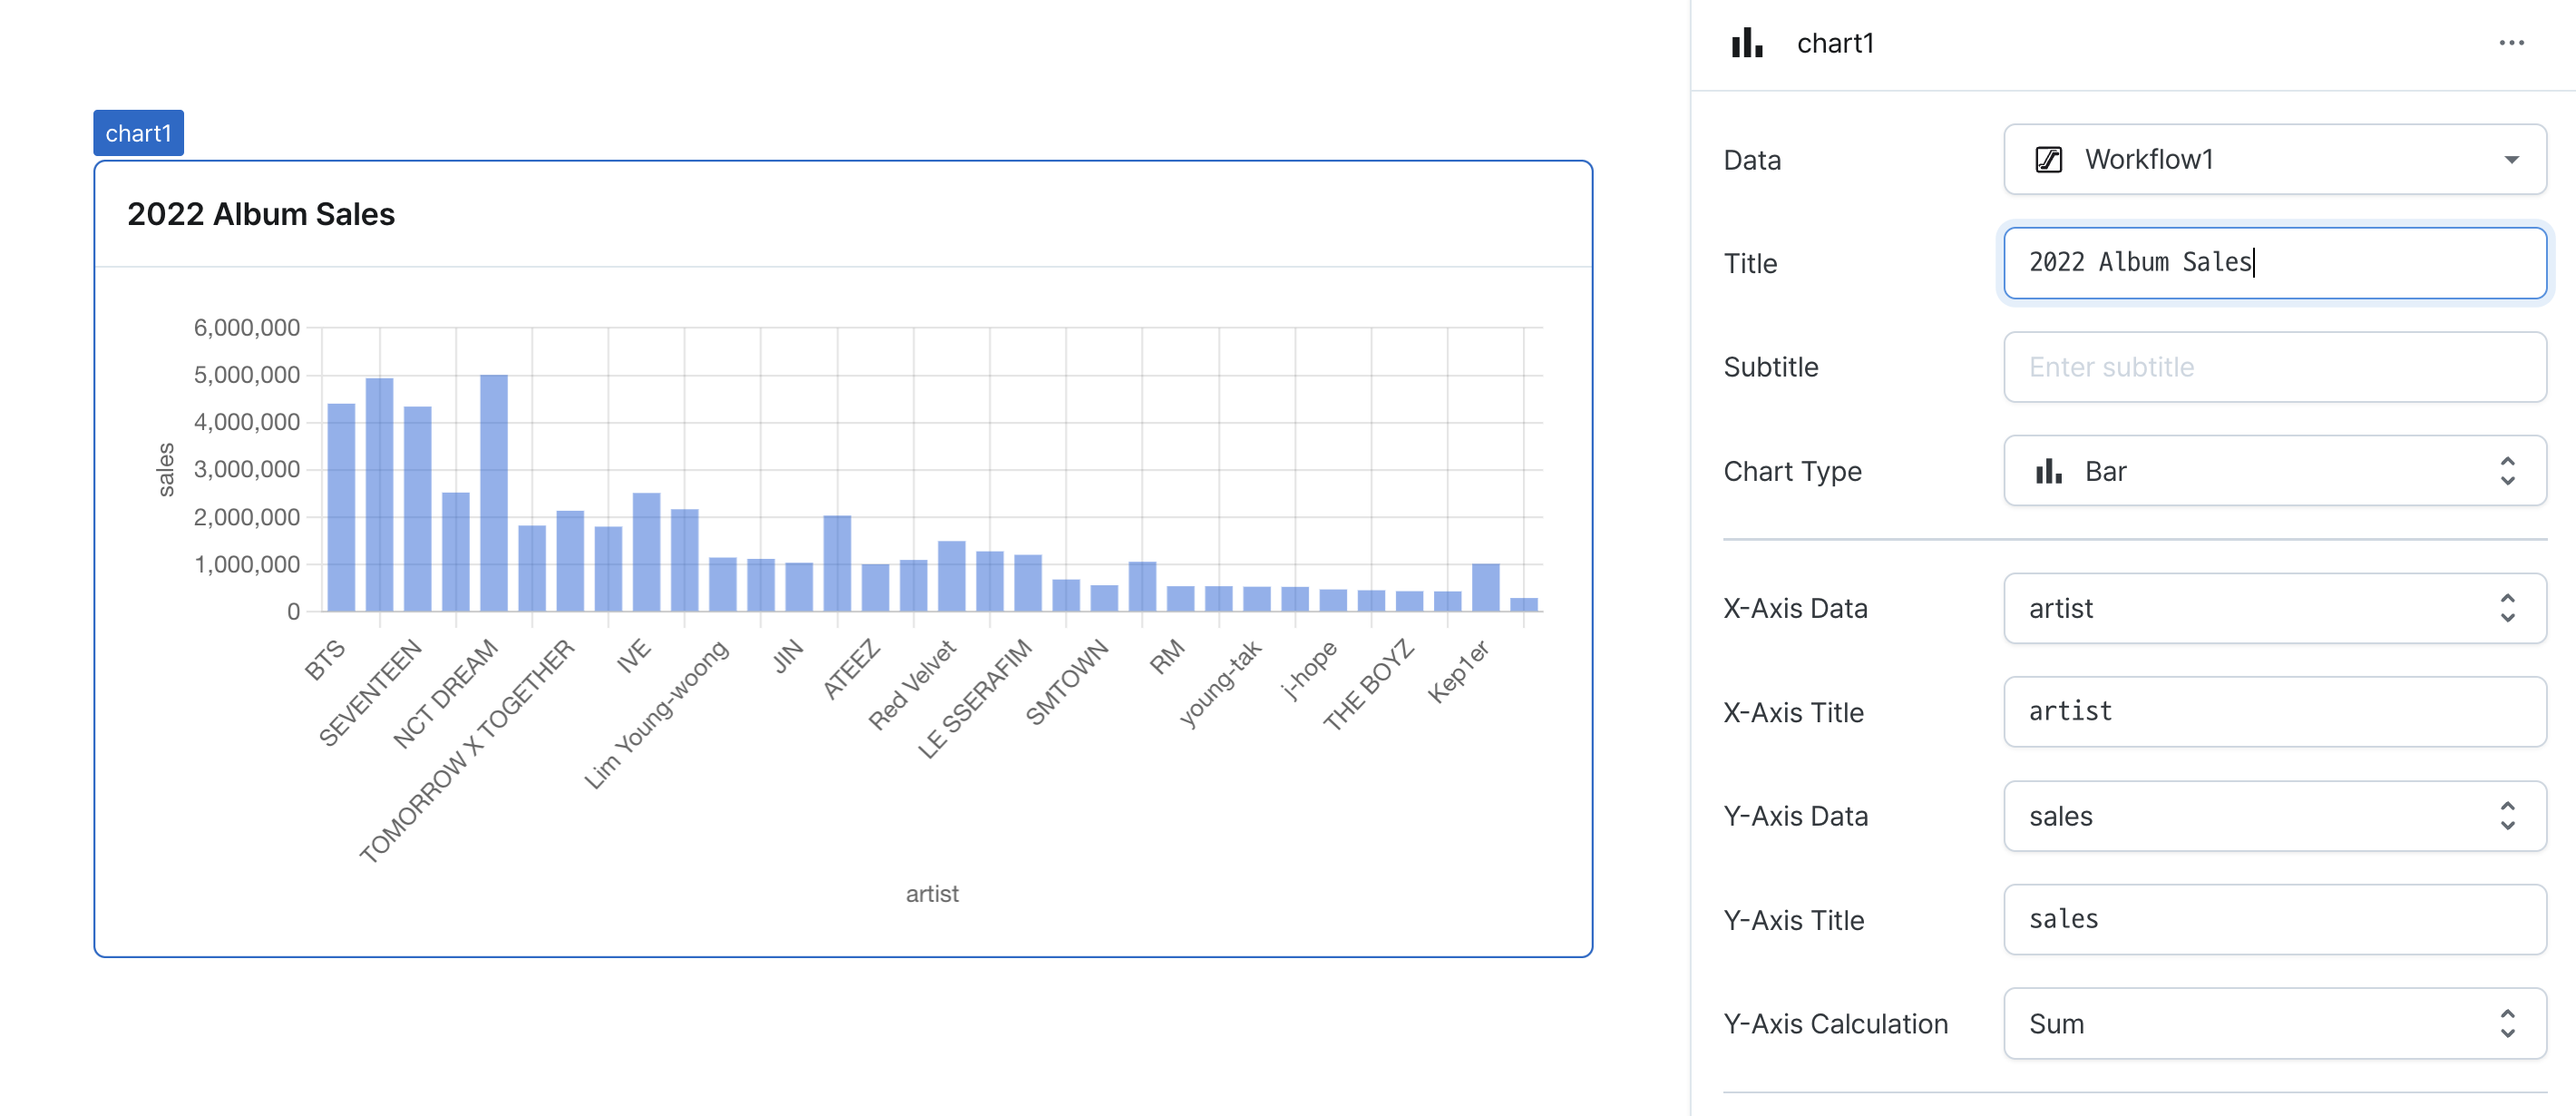
Data (code)
Sets the data series to be visualized in the chart.
Can be set through workflow results, direct input.
Title (title)
Sets the main chart heading.
Supports Template Text for dynamic content.
Subtitle (subtitle)
Sets the secondary chart heading.
Supports Template Text for dynamic content.
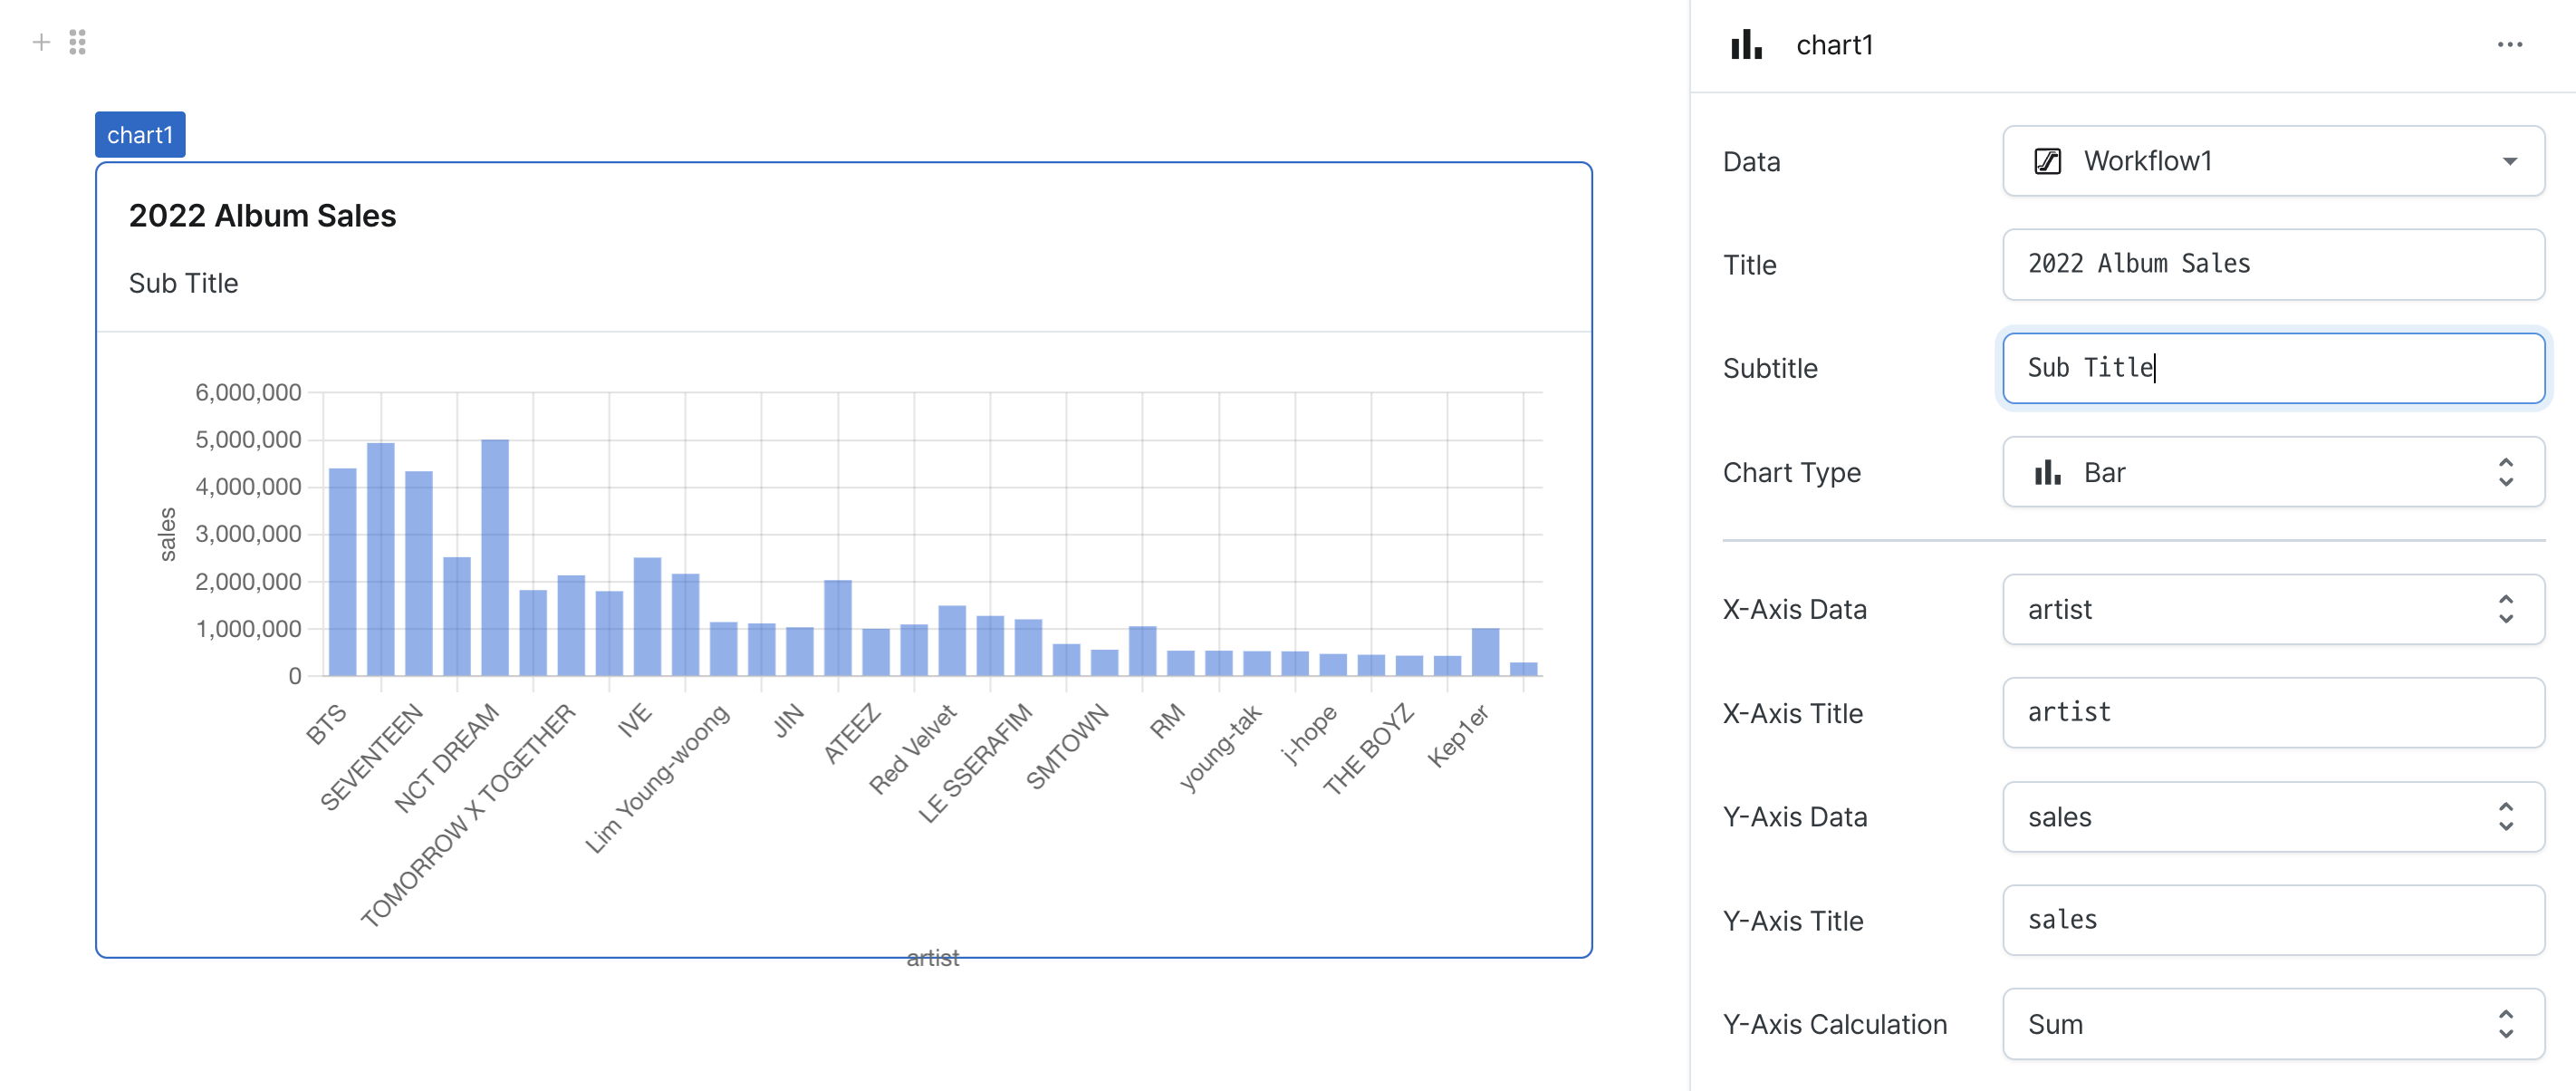
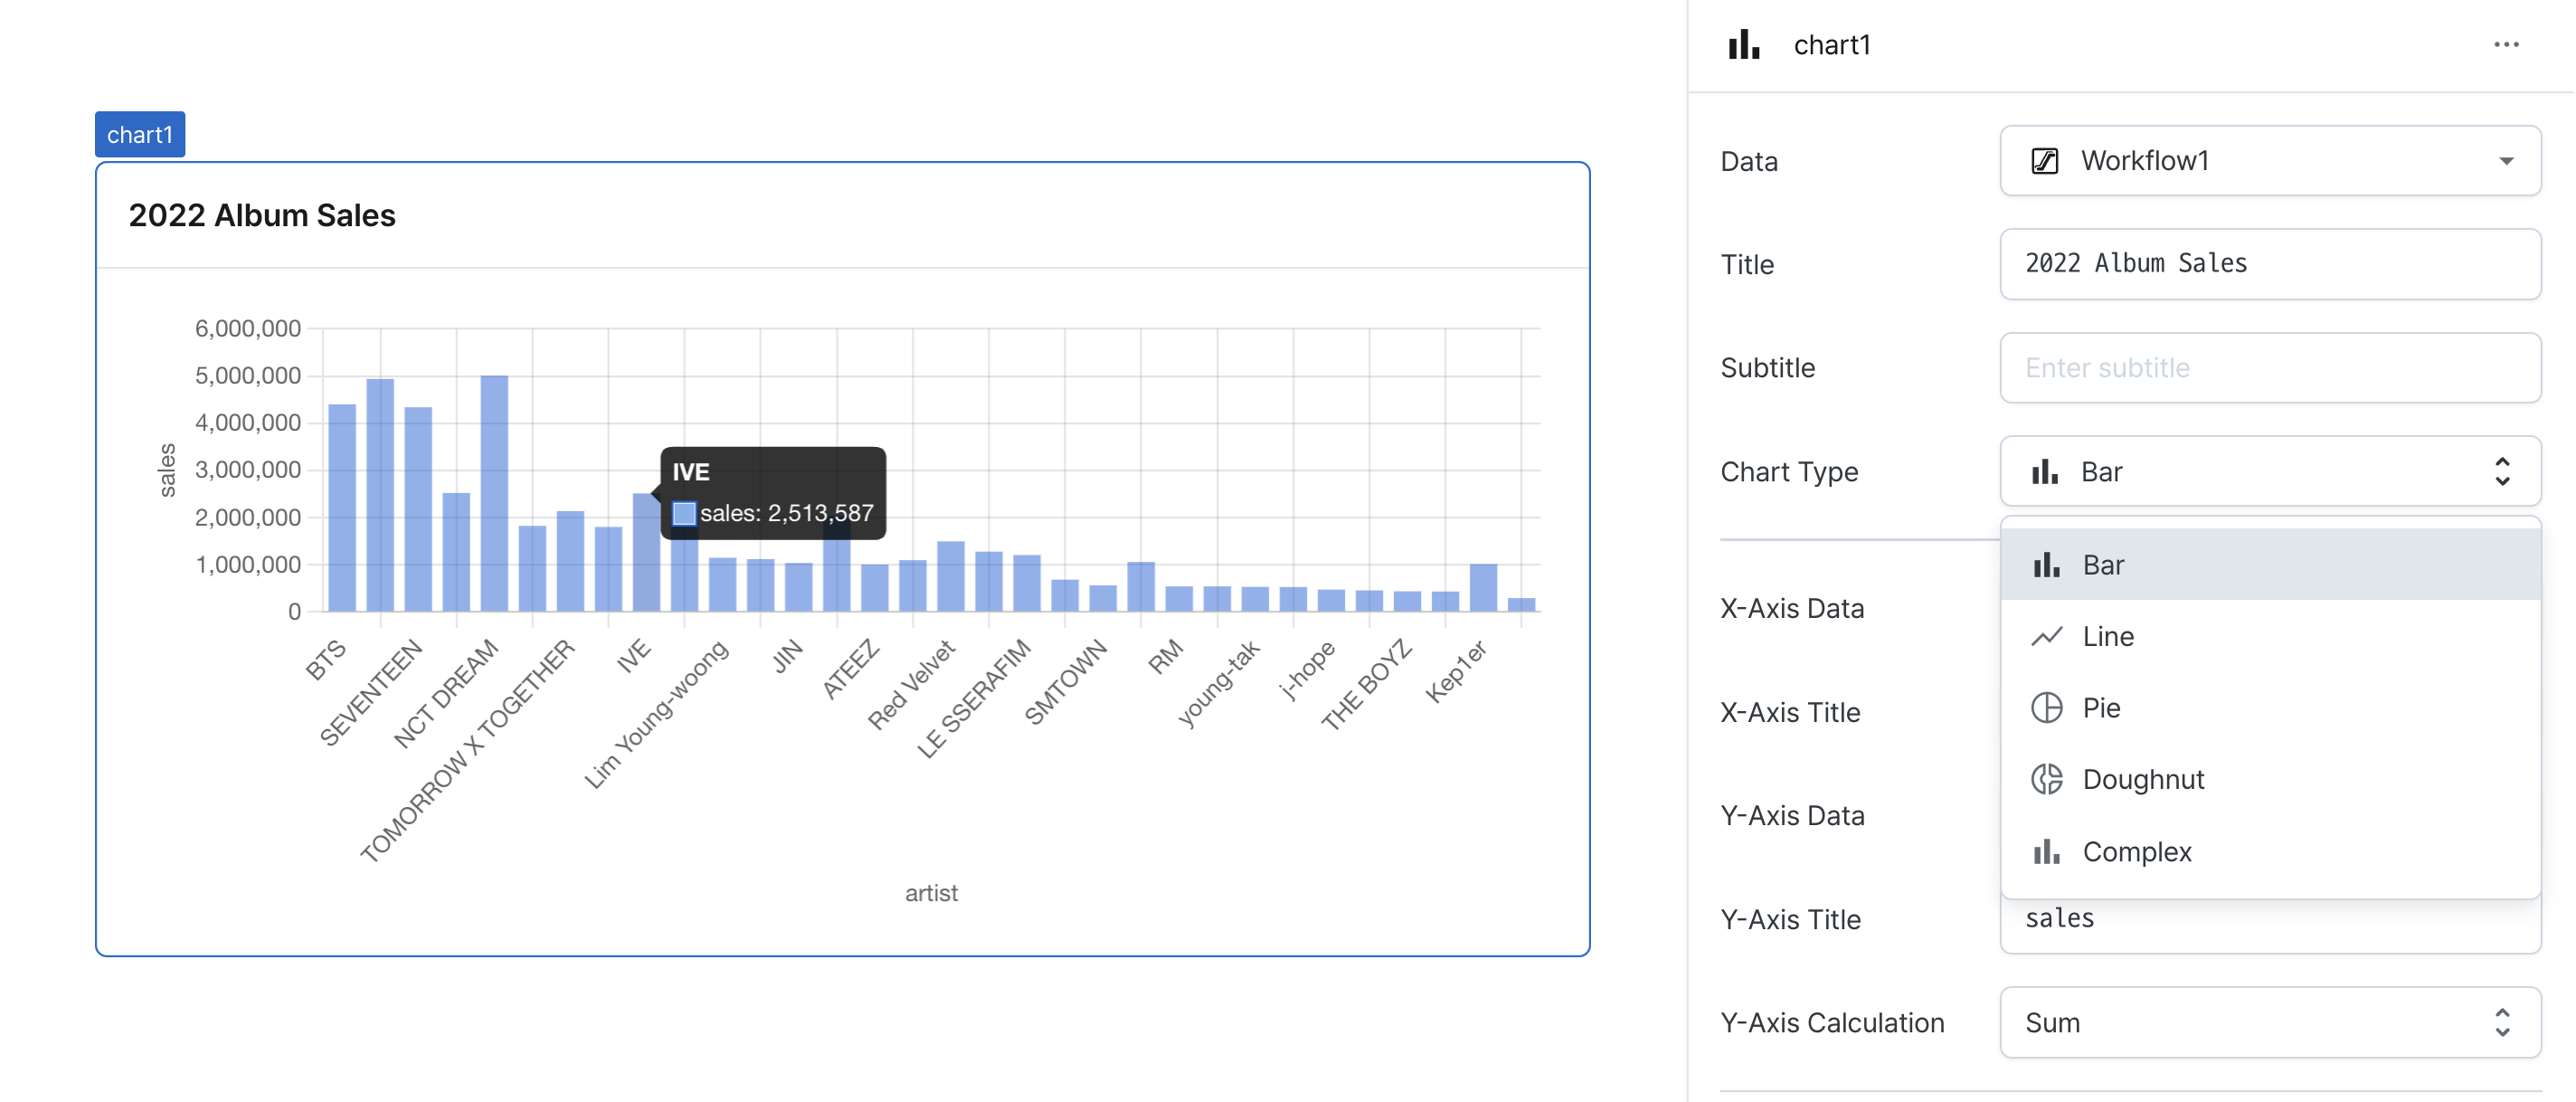
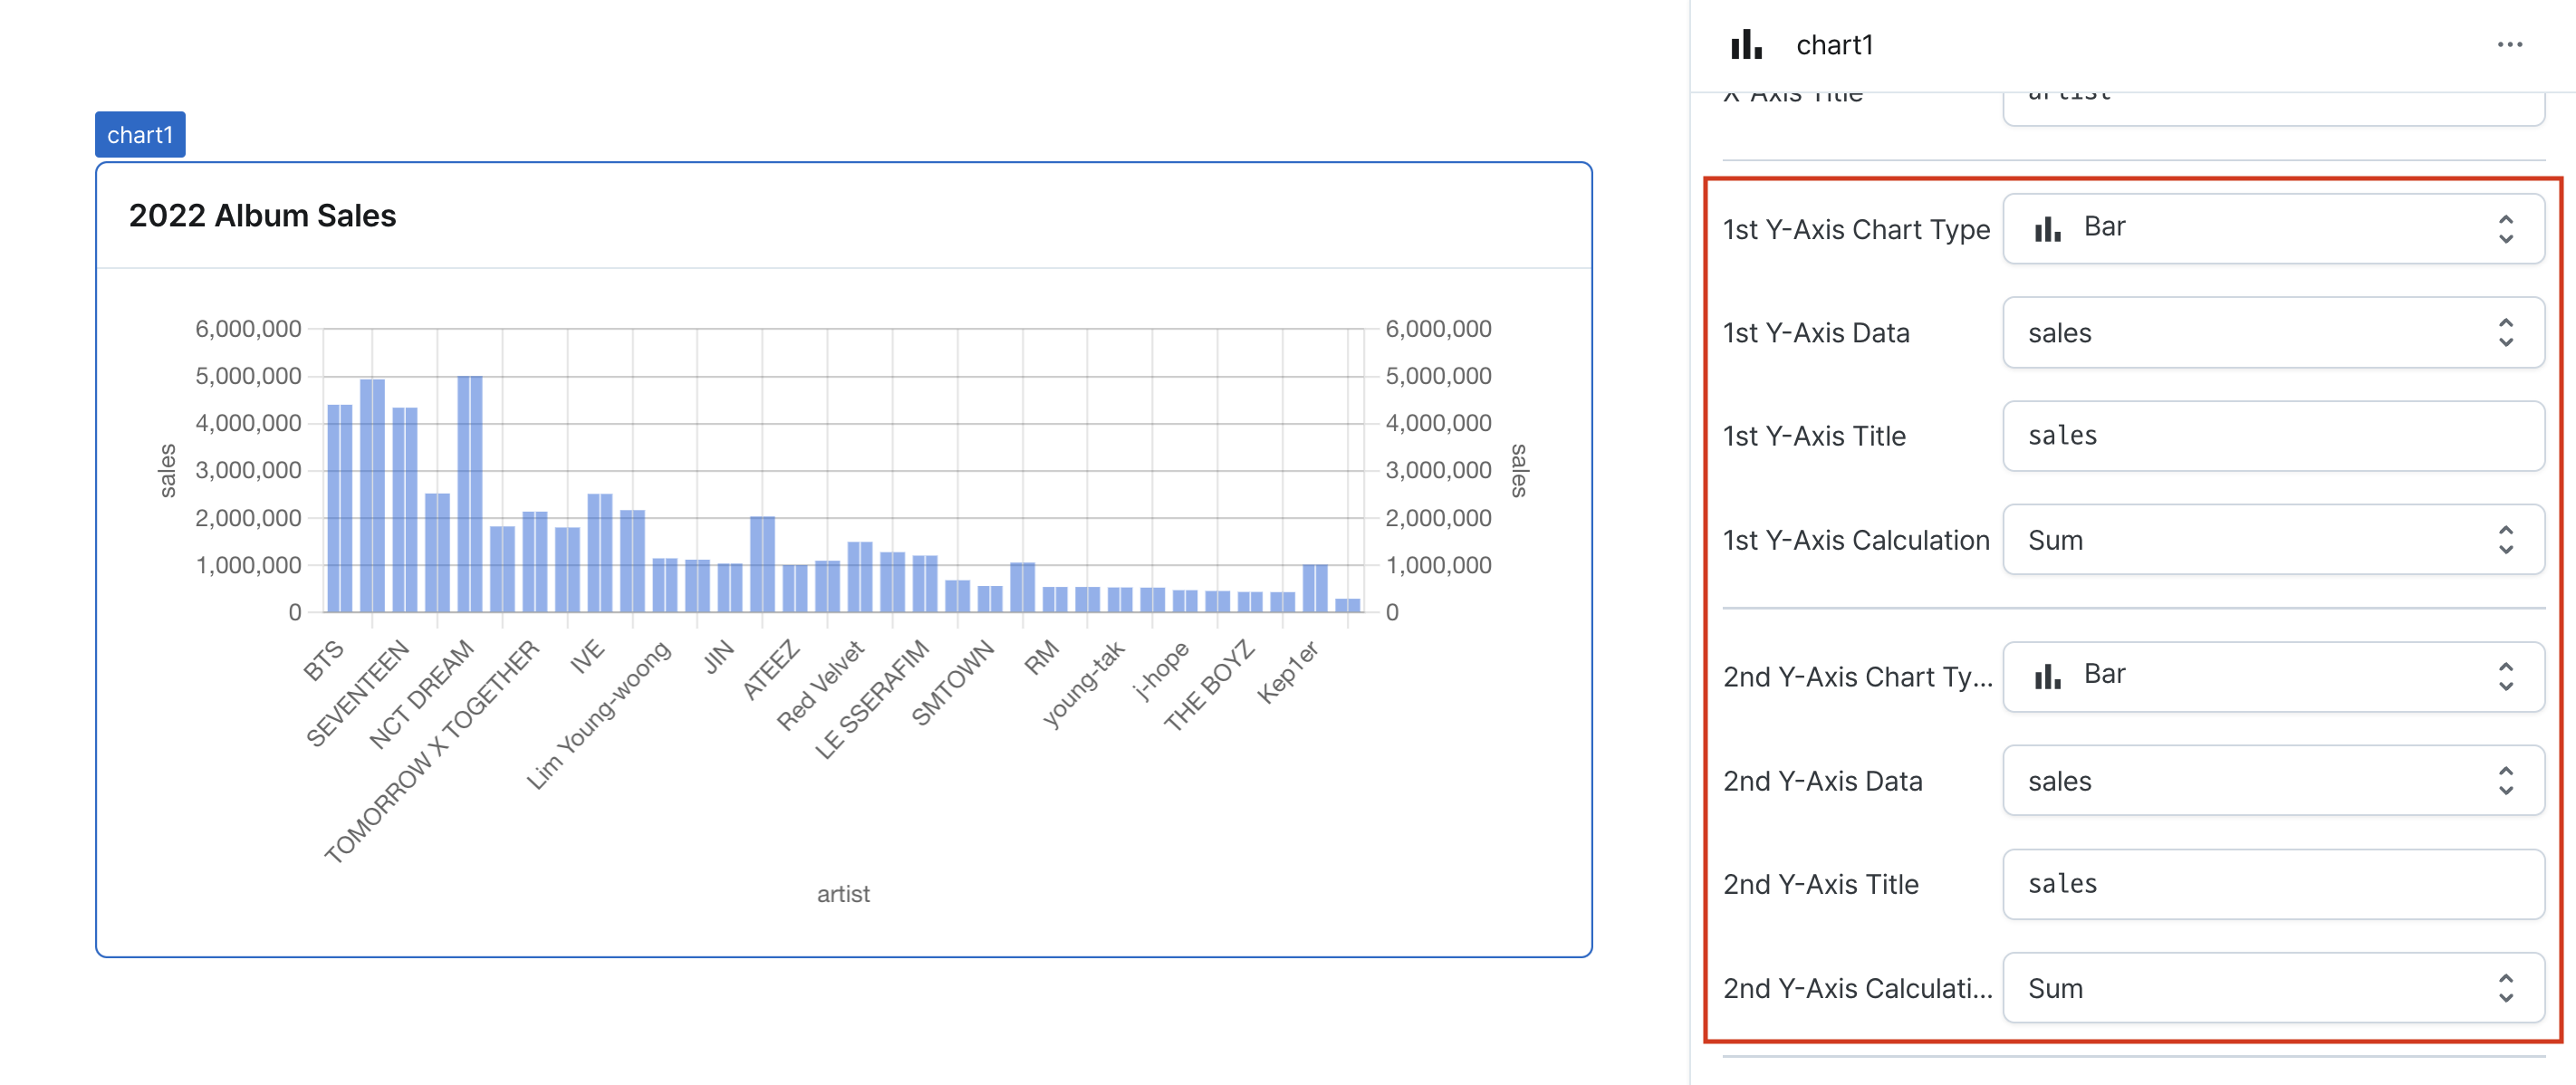
Chart Type (type)
Sets the chart visualization type.
Options:
bar: Vertical bar chart -line: Line graphpie: Pie chartdoughnut: Doughnut chartcomplex: Multi-axis visualization (supports bar and line only)
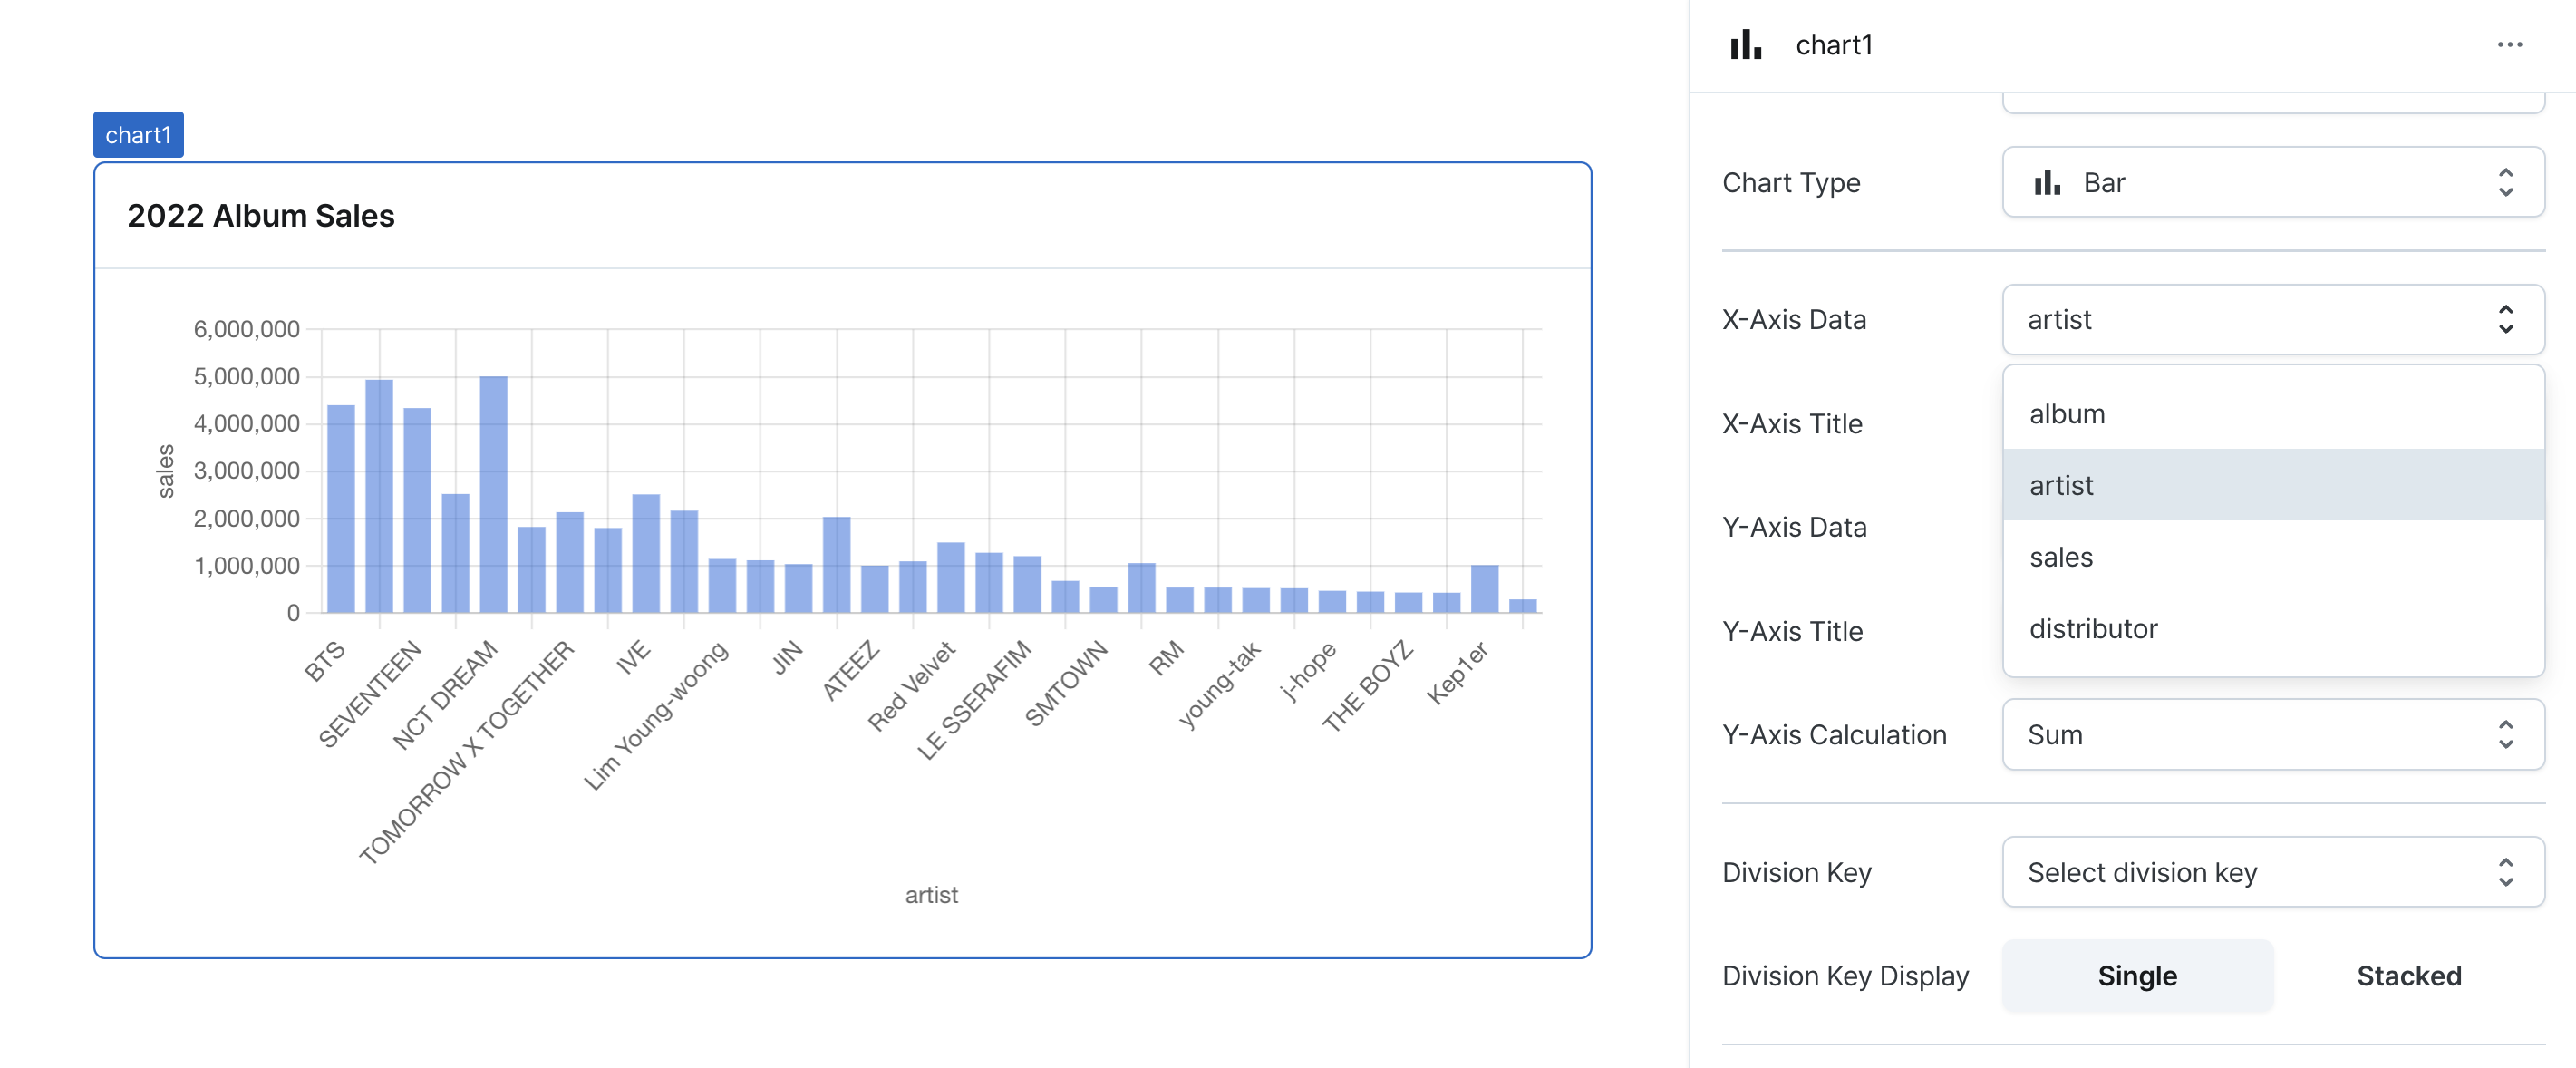
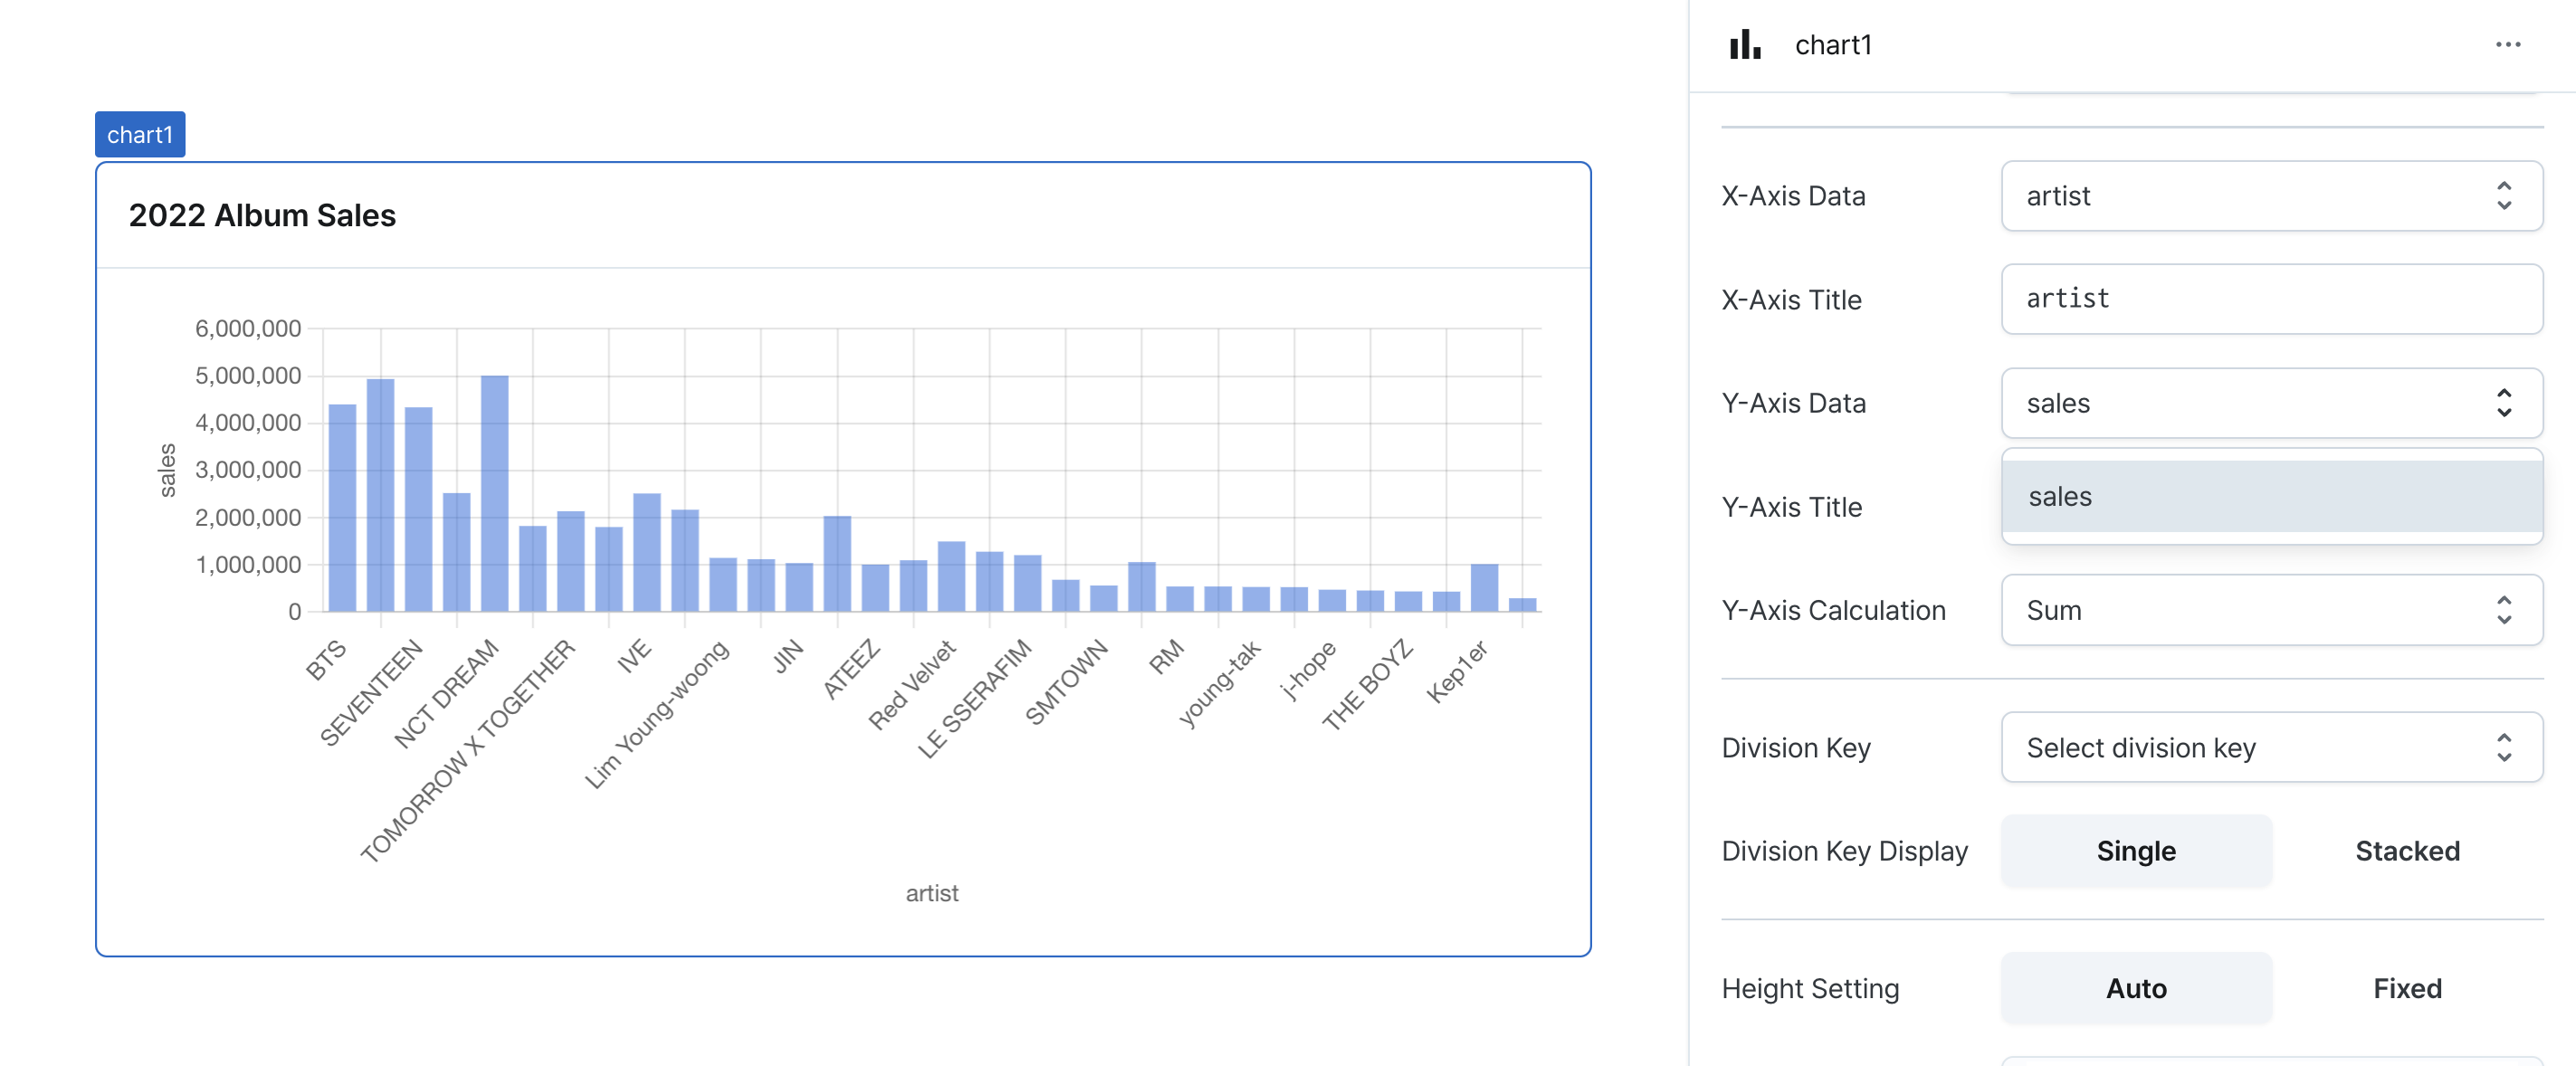
X-Axis Data and Title (xAxis)
Configures the horizontal axis.
Settings:
- Data series key
- Axis label (supports Template Text)
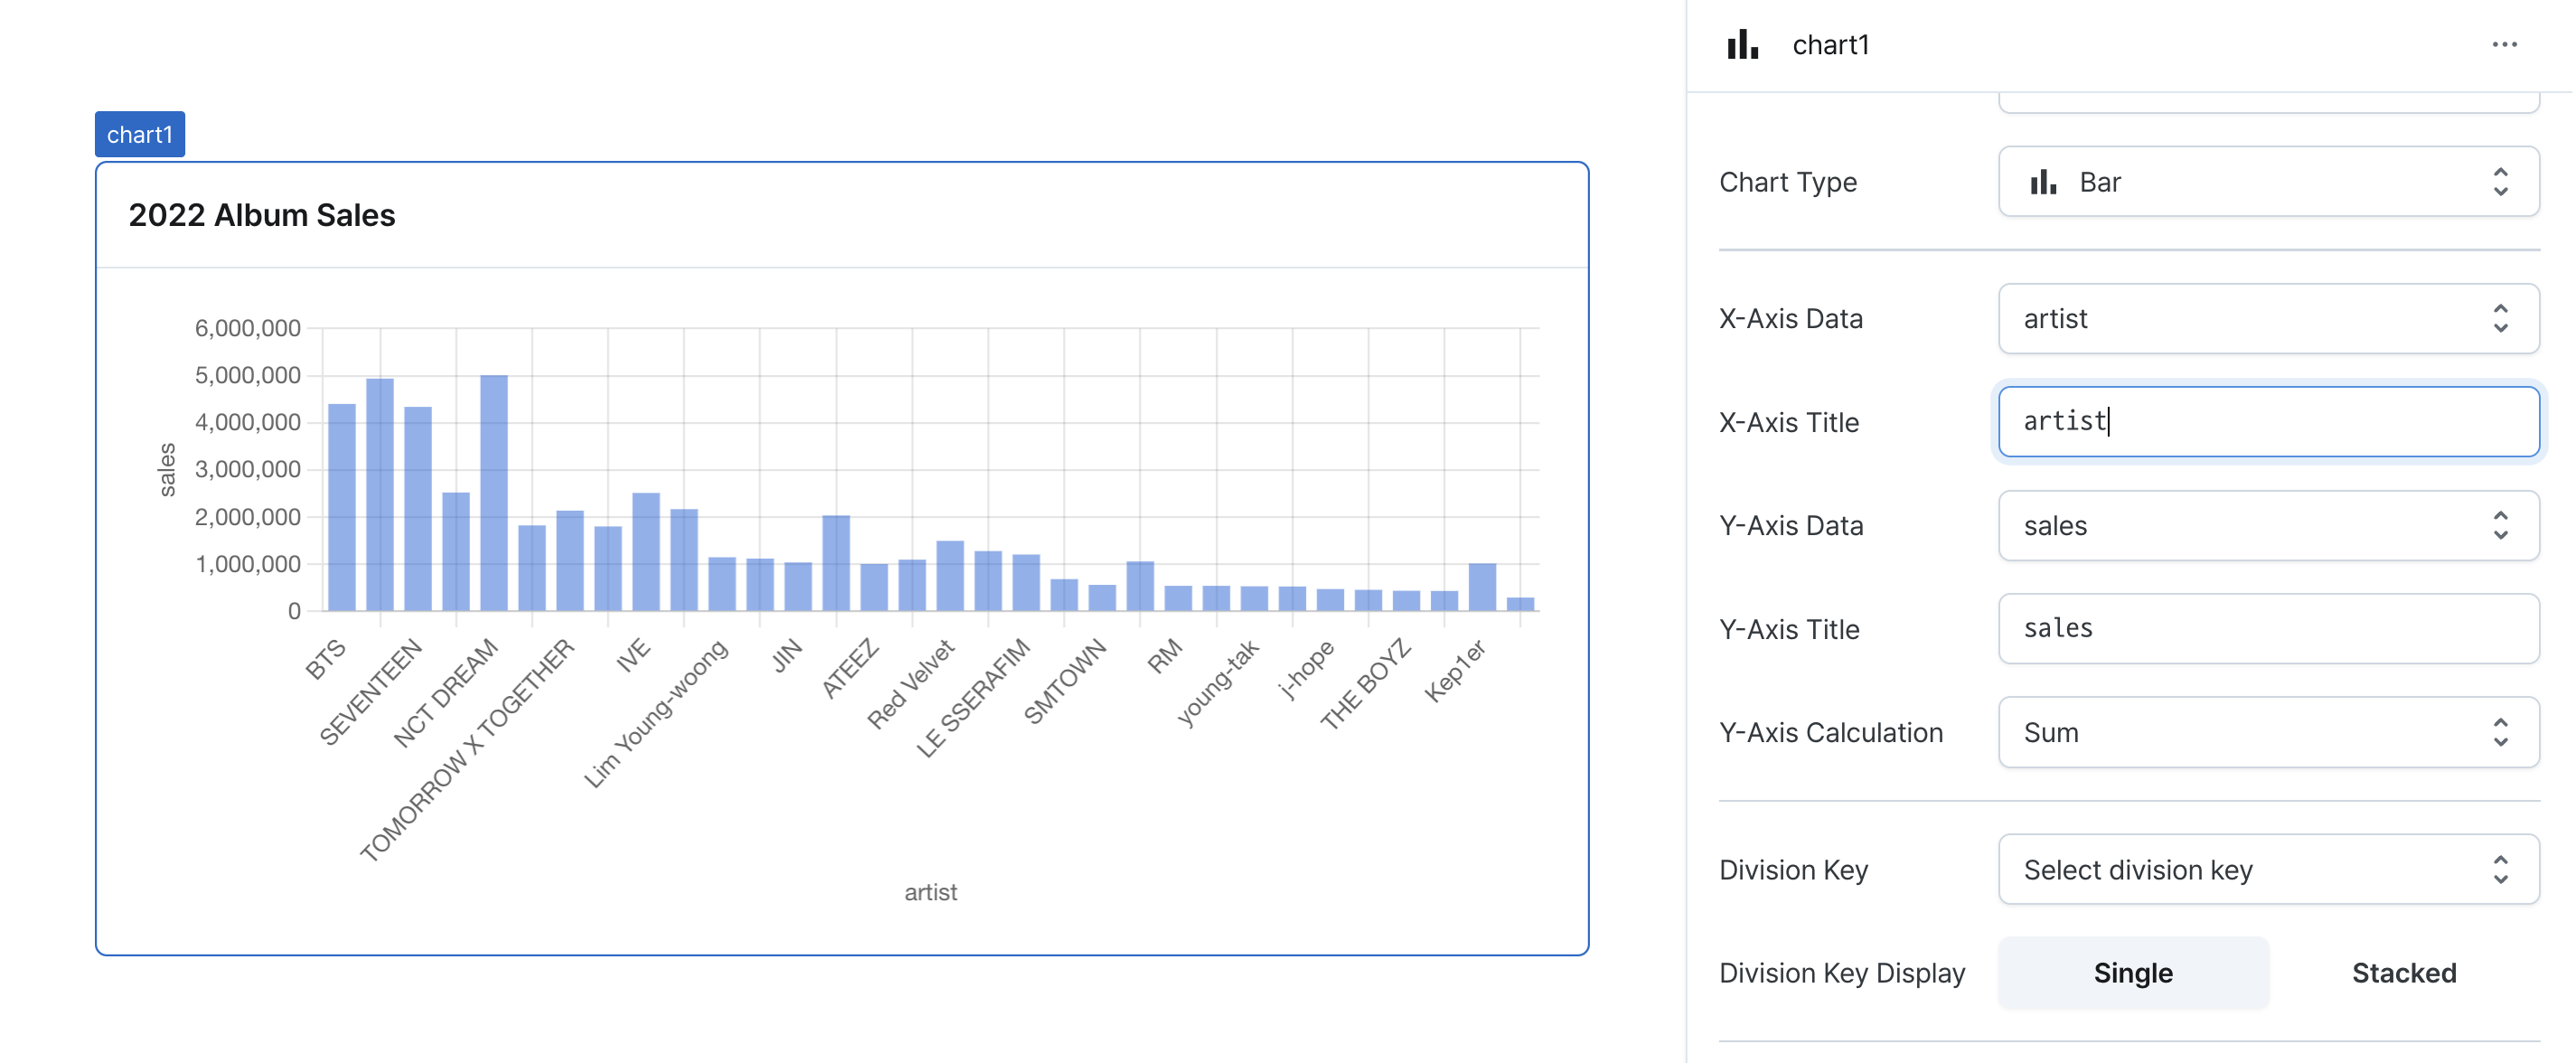
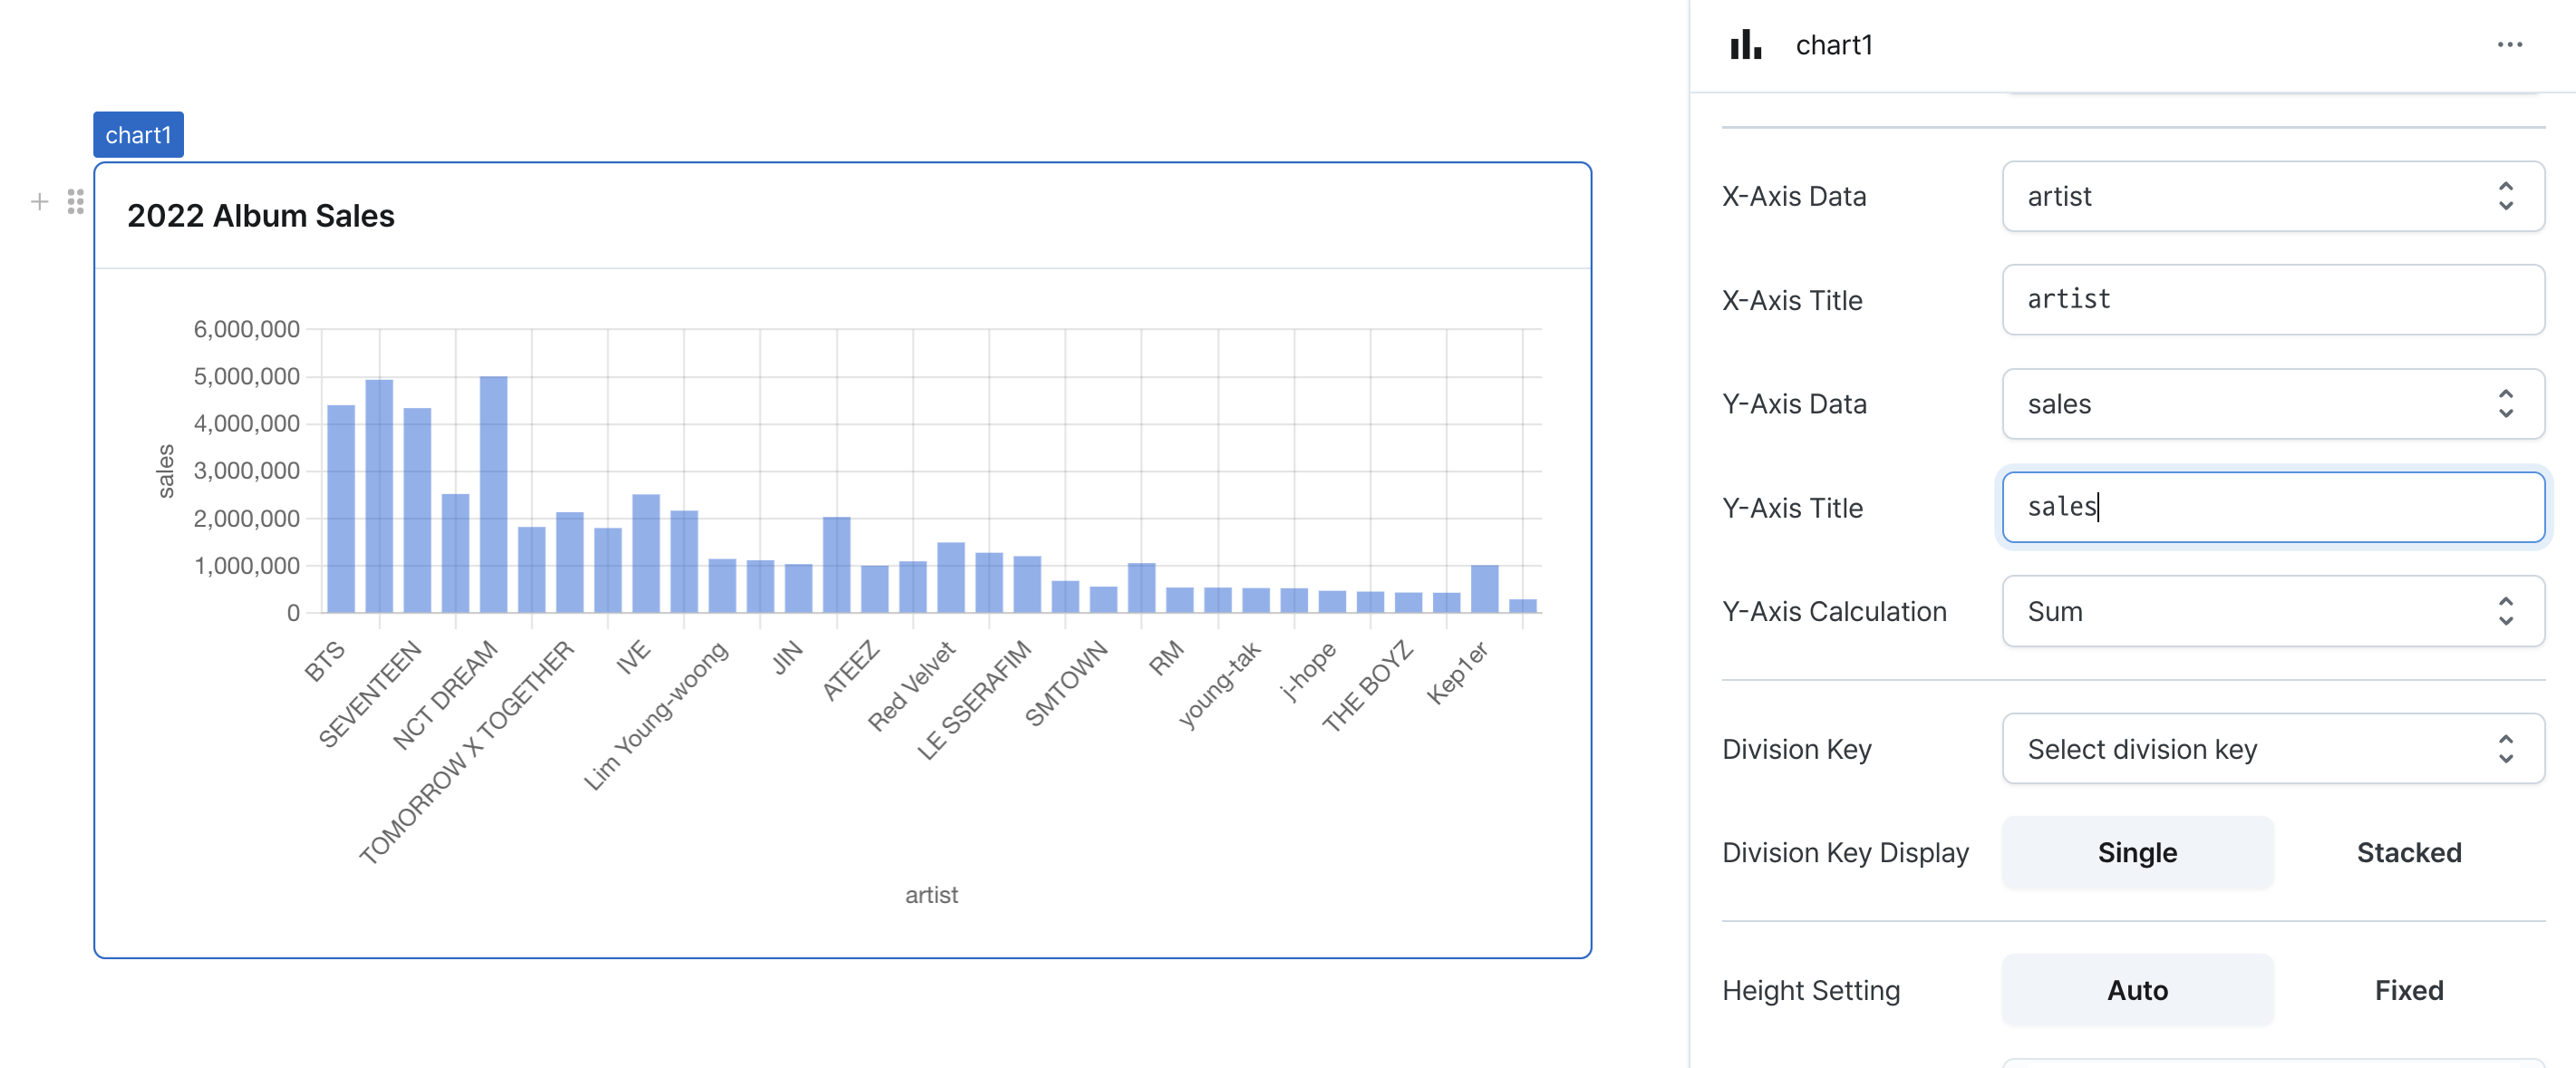
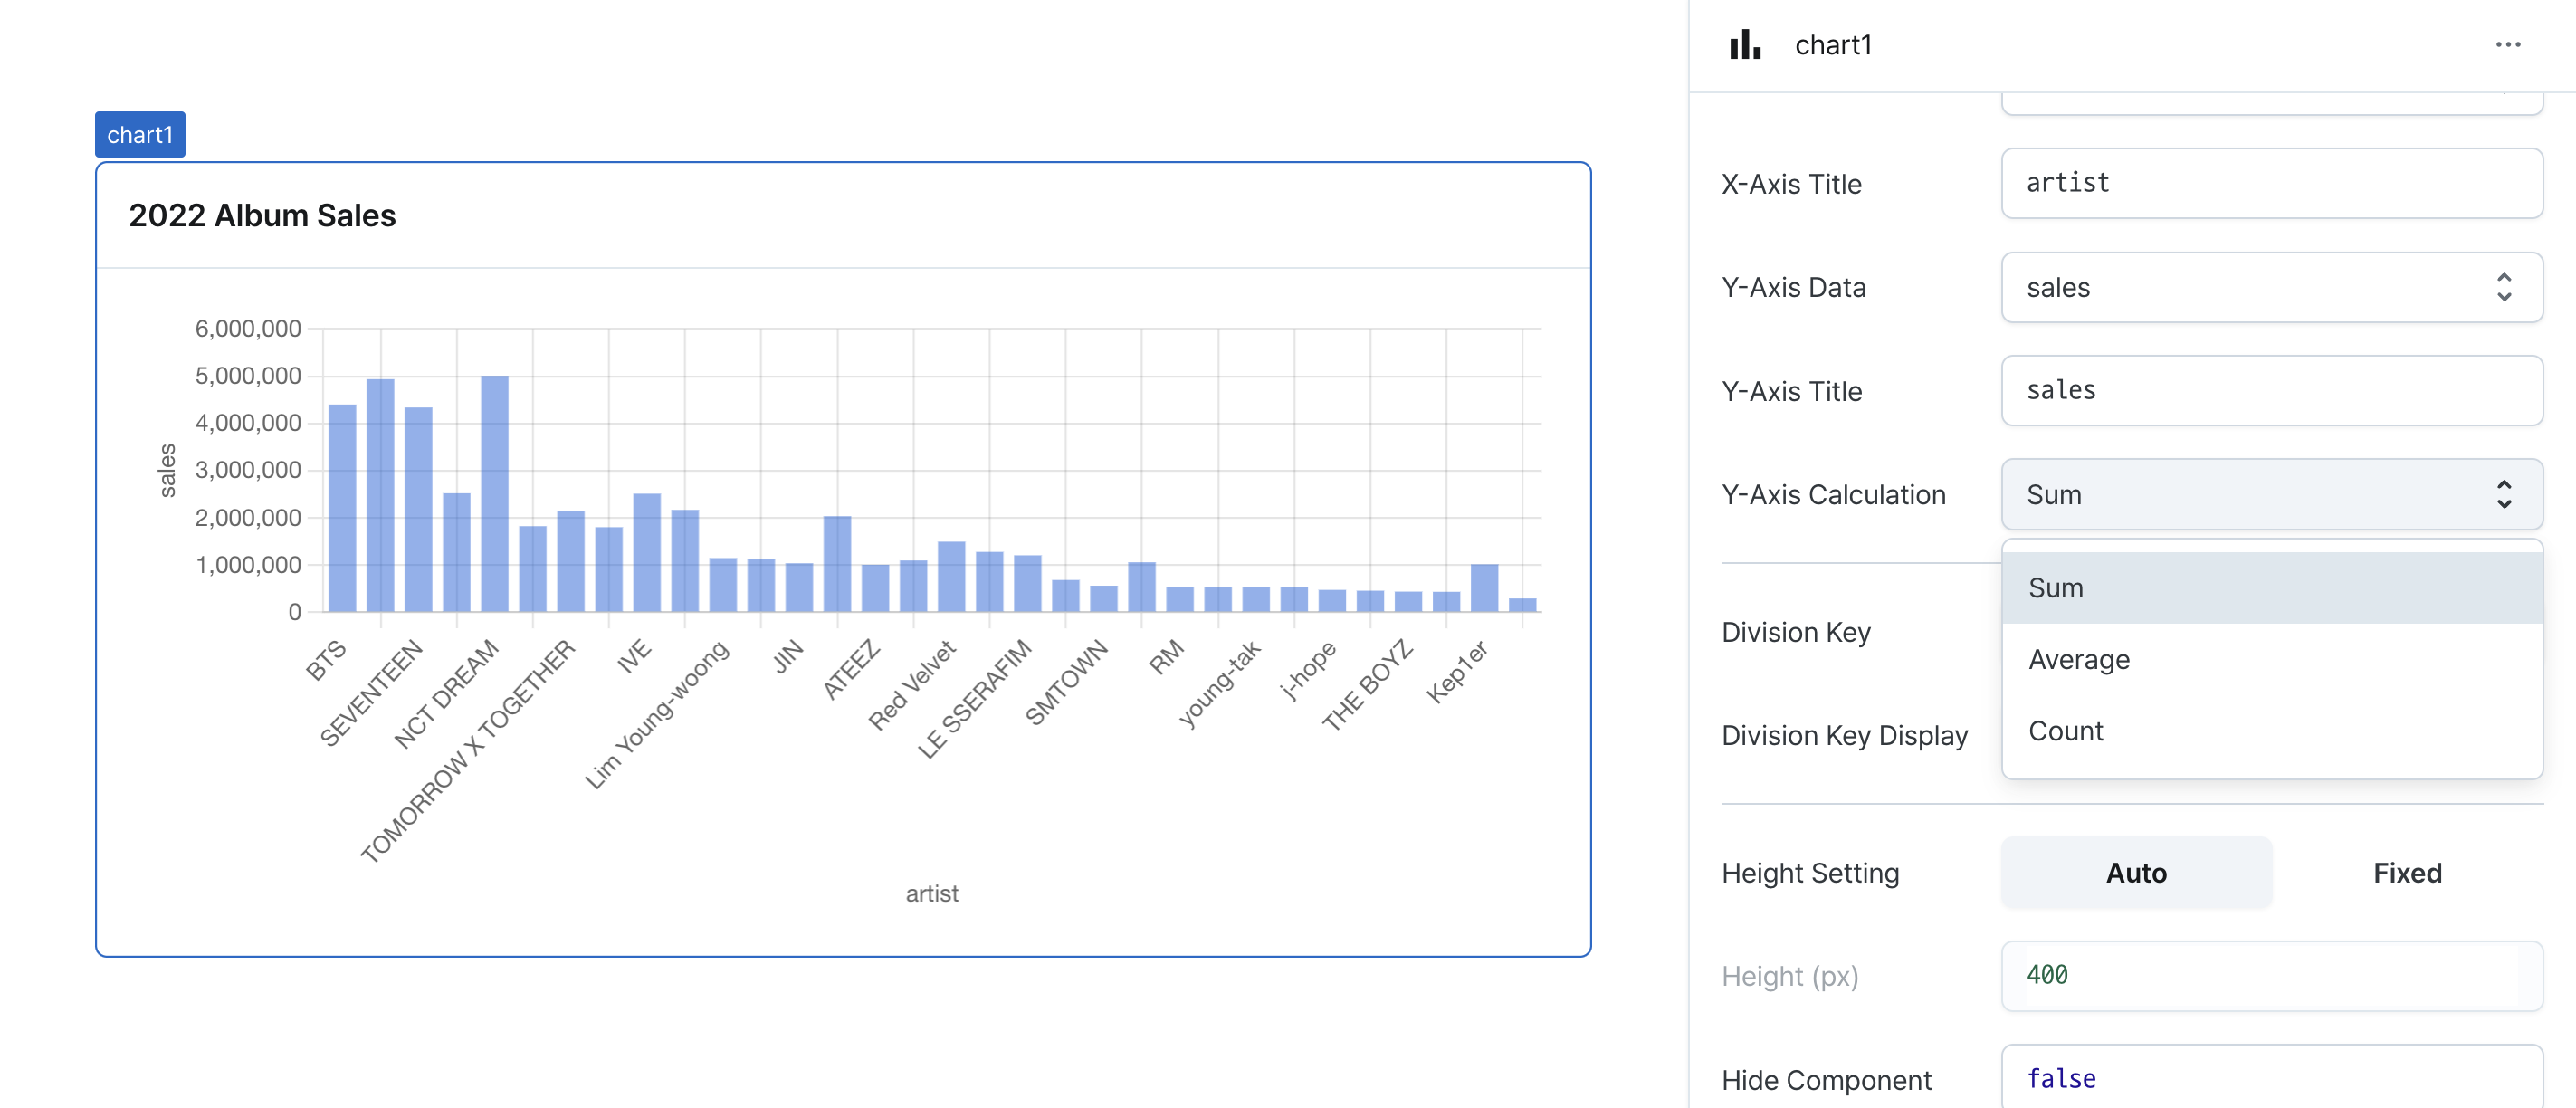
Y-axis Type, Title, Calculation Function (datasets)
Sets the type, title and calculation function for Y-axes.
Y-axis title supports Template Text.
For complex charts, multiple Y-axes can be configured.
Y-axis calculation functions include sum, average, and count.
Division Key (divider)
Sets a data field for series grouping.
Used to split data into multiple series.

Division Key Display (isStacked)
Enables stacked bar visualization.
Only applicable when using divider with bar charts.
Height Setting (isHeightFixed)
Controls height behavior of the component.
When set to 'auto', height adjusts automatically to content.
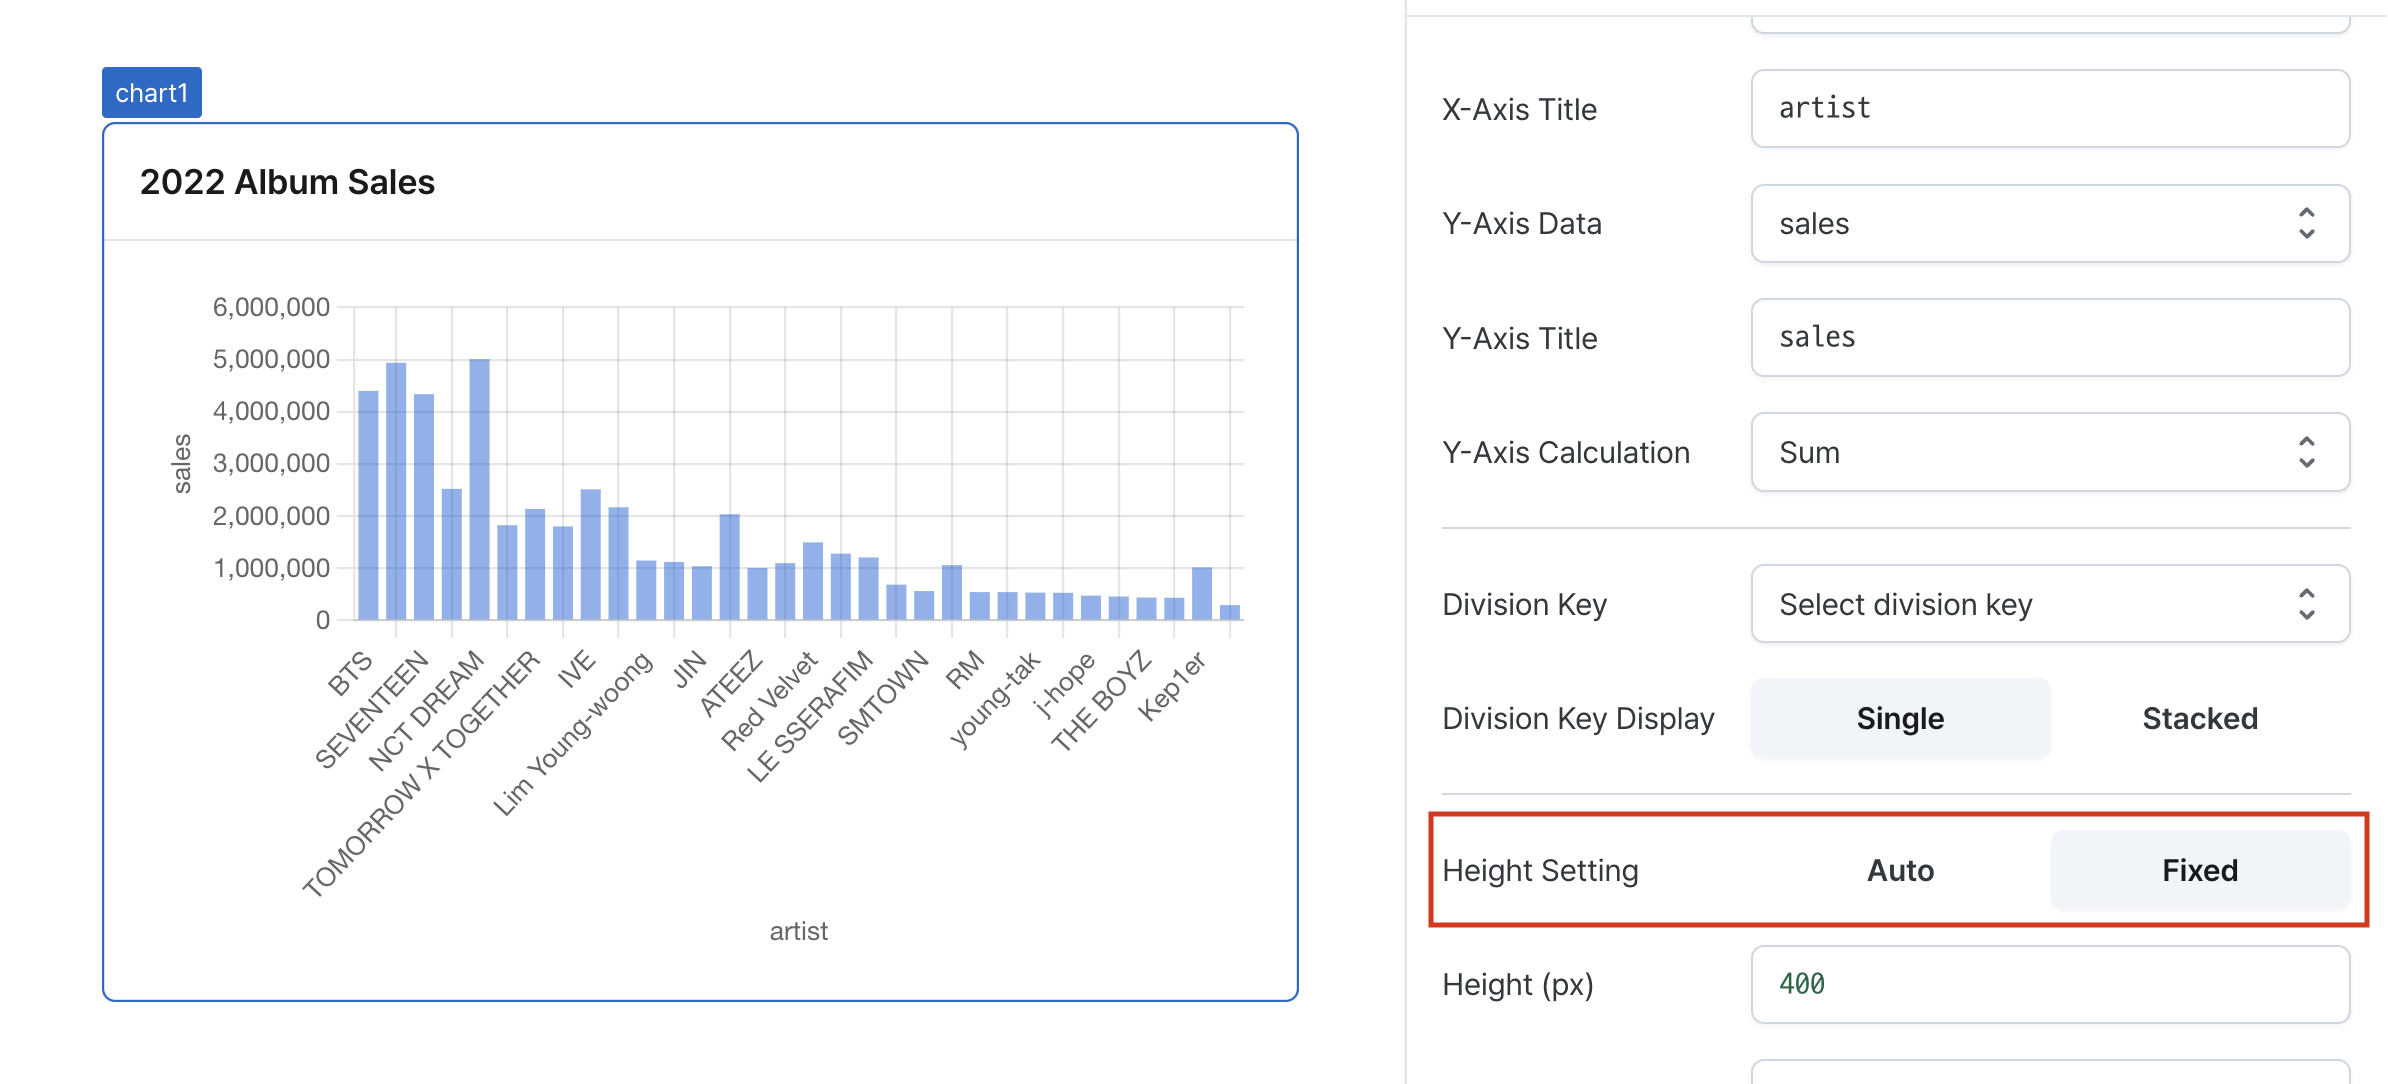
Height (px) (contentHeight)
Sets the component's vertical height.
Can be set through workflow results, direct input.
Hide Component (isHidden)
Controls visibility of the component.
When set to true:
- Hidden in deployed view
- Visible with reduced opacity in edit mode
Type Definitions
type ChartData = Record<string, unknown>[];

type ChartType = 'bar' | 'line' | 'pie' | 'doughnut' | 'complex';

type ChartDatasetType = 'bar' | 'line';

type ChartAggregationFn = 'avg' | 'count' | 'sum';

interface ChartDataset {
  type: ChartDatasetType;
  key: string;
  label: string;
  aggregationFn: ChartAggregationFn;
}

export interface ChartDivider {
  key: string;
}